harmony 鸿蒙分析AppFreeze(应用无响应)
分析AppFreeze(应用无响应)
用户在使用应用时,如果出现点击无反应或应用无响应等情况,并且持续时间超过一定限制,就会被定义为应用无响应(appfreeze)。系统会检测应用无响应,并生成appfreeze日志,供应用开发者分析。
说明:
本文仅适用于Stage模型下的应用。在根据本文分析日志前,开发者需要具备JS在系统中运行情况、C++程序堆栈信息的相关基础知识,并对应用相关的子系统有一定了解。
应用无响应检测能力点
目前应用无响应检测从以下三个维度检测,了解其原理有助于应用开发者定位和分析appfreeze故障。
| 故障类型 | 说明 |
|---|---|
| THREAD_BLOCK_6S | 应用主线程卡死超时。 |
| APP_INPUT_BLOCK | 用户输入响应超时。 |
| LIFECYCLE_TIMEOUT | Ability生命周期切换超时。 |
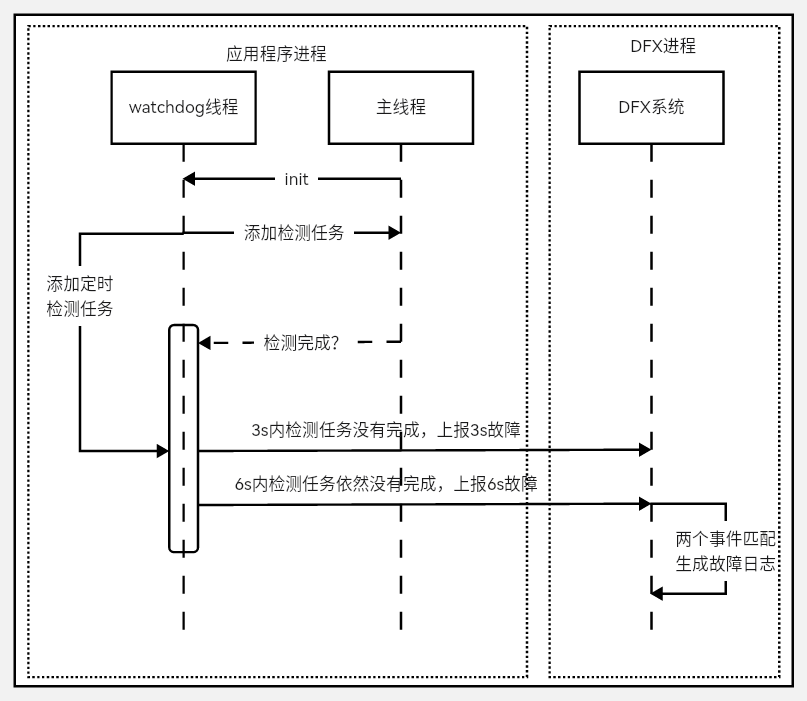
THREAD_BLOCK_6S 应用主线程卡死超时
发生该故障,表示当前应用主线程有卡死或者执行任务过多的情况,影响应用的流畅度和体验。
检测原理:应用的watchdog线程定期向主线程插入判活检测任务。如果判活检测超过3s未被执行,将上报THREAD_BLOCK_3S告警事件;如果超过6s仍未被执行,将上报THREAD_BLOCK_6S主线程卡死事件。两个事件匹配生成THREAD_BLOCK的应用无响应日志。
检测原理如下图:
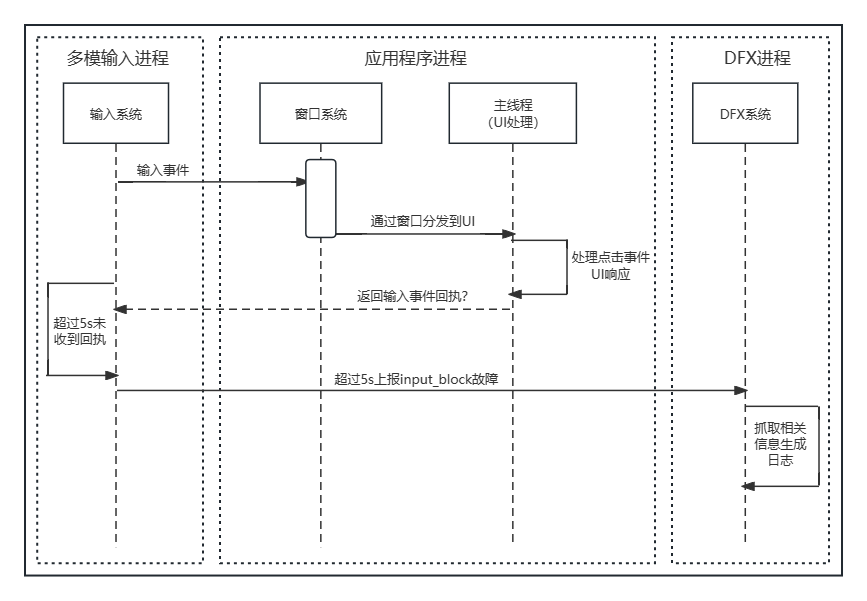
APP_INPUT_BLOCK 用户输入响应超时
该故障是指点击事件超过5s未得到响应。
检测原理:用户点击应用时,输入系统会向应用侧发送点击事件;应用侧的响应反馈回执超时,则上报该故障。
检测原理如下图:
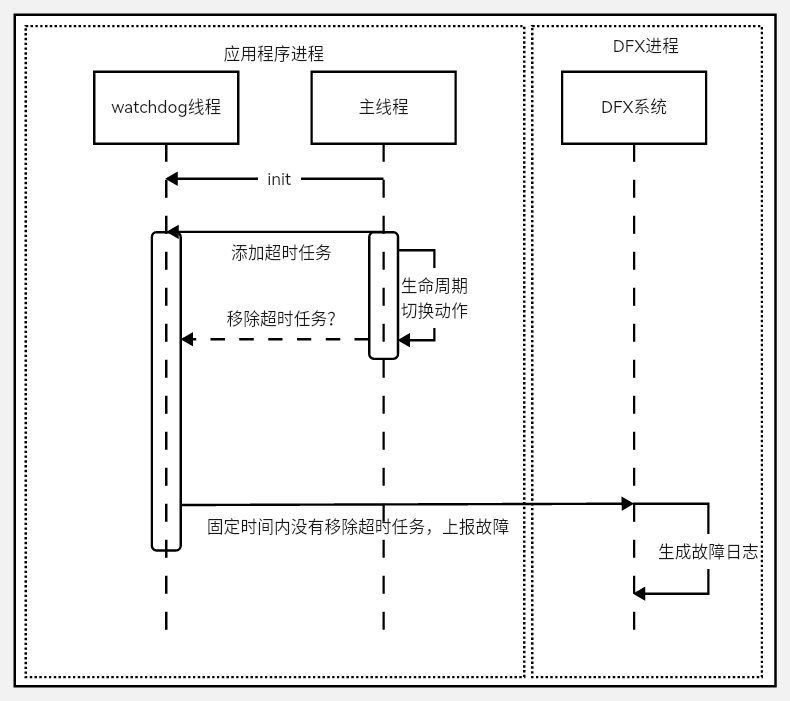
生命周期切换超时
生命周期切换超时分为Ability生命周期切换超时和PageAbility生命周期切换超时。
该故障发生在生命周期切换过程中,影响应用内Ability的切换或者不同PageAbility之间的切换。
检测原理是:在生命周期切换开始的位置向watchdog线程插入超时任务,切换完成之后移除超时任务,固定时间内未成功移除任务将上报故障。
生命周期切换超时由LIFECYCLE_HALF_TIMEOUT和LIFECYCLE_TIMEOUT两个事件组合而成。LIFECYCLE_HALF_TIMEOUT作为LIFECYCLE_TIMEOUT的告警事件,抓取binder等信息。
不同的生命周期,对应的超时时间各不相同。具体如下表所示:
| 生命周期 | 超时时间 |
|---|---|
| Load | 10s |
| Terminate | 10s |
| Connect | 3s |
| Disconnect | 0.5s |
| Foreground | 5s |
| Background | 3s |
应用无响应日志分析
应用无响应(appfreeze)故障需要结合应用无响应日志和流水hilog日志进行分析。
当前提供一个故障分析示例,请开发者根据具体问题具体分析。
应用无响应日志主要分以下几个模块信息:
日志头部信息
| 字段 | 说明 |
|---|---|
| Reason | 应用无响应原因,与应用无响应检测能力点对应。 |
| PID | 发生故障时候的pid。 |
| PACKAGE_NAME | 应用进程包名。 |
Generated by HiviewDFX@OpenHarmony
================================================================
Device info:OpenHarmony 3.2
Build info:OpenHarmony 5.1.0.59
Fingerprint:9f232fb5053c092144eedaa39ceecd67a6997db69467973b4d5fe786f184374d
Module name:com.example.freeze
Version:1.0.0
VersionCode:1000000
PreInstalled:No
Foreground:Yes
Pid:2212
Uid:20010044
Reason:THREAD_BLOCK_6S
appfreeze: com.example.freeze THREAD_BLOCK_6S at 20170817192244
DisplayPowerInfo:powerState:UNKNOWN
>>>>>>>>>>>>>>>>>>>>>>>>>>>>>>>>>>>>>>>>>>>
DOMAIN:AAFWK
STRINGID:THREAD_BLOCK_6S
TIMESTAMP:2017/08/17-19:22:44:952
PID:2212
UID:20010044
PACKAGE_NAME:com.example.freeze
PROCESS_NAME:com.example.freeze
*******************************************
日志主干通用信息
三种Appfreeze事件都包含以下几部分信息。可以通过搜索相关“主要信息字段”的内容,在日志中找到对应的位置。具体信息如下:
| 主要信息字段 | 说明 |
|---|---|
| EVENTNAME | 组成卡死检测事件。 |
| TIMESTAMP | 发生故障时上报事件的时刻,可以根据应用无响应检测能力点中说明的超时时间,在相应流水日志中缩小查看日志的时间范围。 |
| PID | 发生故障时候的pid。 |
| PACKAGE_NAME | 应用进程包名。 |
| MSG | 发生故障时dump信息或者说明信息,后面具体说明。 |
| BinderCatcher | 进程间通信的调用信息,显示调用等待时间长的情况。 |
| PeerBinder Stacktrace | 故障进程相关的对端进程有卡死,会抓取对端的进程堆栈。 |
| cpuusage | 故障时间段整机CPU使用情况。 |
| memory | 故障时间设备内存使用情况。 |
说明:
在整机高负载情况下,采用低开销方式获取调用栈时,可能损失函数名称和build-id信息;获取用户栈失败时,build-id会为空。
MSG字段包含卡死上报的原因和当前应用主线程的队列的任务堆积信息。
主线程队列中任务堆积信息如下:
当前正在运行的任务及其启动时间:如果跟当前日志上报的时间相差很大,则该任务很可能就是卡死的主要原因。
历史任务时间:判断历史任务数量是否过多以及每个任务执行是否耗时过长导致当前新任务无法及时响应。
堆积中还没有执行的任务。
当前进程堆栈示例:
通过搜索pid找到应用栈信息。以下堆栈示例显示,窗口通过IPC向系统发送事件时,停留在IPC通信阶段。
OpenStacktraceCatcher -pid==1561 packageName is com.example.myapplication
Result: 0 ( no error )
Timestamp:2017-08-0817:06:53.000
Pid:1561
Uid:20010039
Process name:com.example.myapplication
Tid:1561,Name:i.myapplication
#00 pc 0017888c /system/lib/libark_jsruntime.so
#01 pc 00025779 /system/lib/platformsdk/libipc_core.z.so(OHOS:BinderConnector:WriteBinder(unsigned Long,void*)+56)
#02 pc 000265a5 /system/lib/platformsdk/libipc_core.z.so(OHOS:BinderInvoker:TransactWithDriver(bool)+216)
#03 pc 0002666f /system/lib/platformsdk/libipc_core.z.so(OHOS:BinderInvoker:StartWorkLoop()+18)
#04 pc 000270a9 /system/lib/platformsdk/libipc_core.z.so(OHOS:BinderInvoker:JoinThread(bool)+32)
#05 pc 00023783 /system/lib/platformsdk/libipc_core.z.so(OHOS:IPCWorkThread:ThreadHandler(void*)+290)
#06 pc 00e1c6f7 /system/lib/libace.z.so
#07 pc 0091bbdd /system/lib/libace.z.so
#08 pc 0092fd9d /system/lib/libace.z.so
#09 pc 0092fa5f /system/lib/libace.z.so
#10 pc 0092cd6b /system/lib/libace.z.so
#11 pc 009326a9 /system/lib/libace.z.so
#12 pc 0093054b /system/lib/libace.z.so
#13 pc 009324f3 /system/lib/libace.z.so
#14 pc 003989e1 /system/lib/libace.z.so
#15 pc 0045dd4b /system/lib/libace.z.so
#16 pc 00d24fef /system/lib/libace.z.so
#17 pc 0041e6e9 /system/lib/libace.z.so
#18 pc 0000b4d9 /system/lib/platformsdk/libeventhandler.z.so(OHOS:AppExecFwk:EventHandler:DistributeEvent(std::__h:unique_ptr<0 #19 pc 00012829 /system/lib/platformsdk/libeventhandler.z.so))
#20 pc 00011841 /system/lib/platformsdk/libeventhandler.z.so(OHOS:AppExecFwk:EventRunner:Run()+64)
#21 pc 00054a8b /system/lib/libappkit_native.z.so(OHOS:AppExecFwk:MainThread:Start()+278)
#22 pc 00011503 /system/bin/appspawn
#23 pc 0001141f /system/bin/appspawn
#24 pc 0000ee97 /system/bin/appspawn
BinderCatcher信息示例:
通过搜索pid,了解当前进程与哪个进程在通信及其同步通信的等待时长。
示例表明,当前1561进程向685进程请求通信,等待超过10s未收到响应。
PeerBinderCatcher -pid==1561 Layer_==0


BinderCatcher --
    1561:1561 to 685:0 code 0 Wait:10.366245919 s,  ns:-1:-1 to -1:-1, debug:1561:1561 to 685:0, active_code:0 active_thread:0, pending_async_proc=0
    1329:1376 to 487:794 code 0 Wait:0.12070041 s,  ns:-1:-1 to -1:-1, debug:1329:1376 to 487:794, active_code:0 active_thread:0, pending_async_proc=0

pid   context  request  started  max  ready free_async_space
1561   binder    0       3       16     4       520192
544    binder    0       4       16     5       520192
1104   binder    0       1       16     2       520192
1397   binder    0       1       16     3       520192
...
PeerBinder Stacktrace信息示例:
示例展示了对端卡死进程685的堆栈信息。
Binder catcher stacktrace, type is peer, pid : 685
Result: 0 ( no error )
Timestamp:2017-08-0817:06:55.000
Pid:685
Uid:1000
Process name:wifi_manager_service
Tid:658,Name:wifi_manager_service
#00 pc 000669f0 /system/lib/ld-musl-arm.so.1
#01 pc 000c60cc /system/lib/ld-musl-arm.so.1
#02 pc 000c5040 /system/lib/ld-musl-arm.so.1
#03 pc 000c6818 /system/lib/ld-musl-arm.so.1(__pthread_cond_timedwait_time64+596)
#04 pc 000bd058 /system/lib/libc++.so
#05 pc 0008592c /system/lib/ld-musl-arm.so.1(ioctl+72)
#06 pc 00025779 /system/lib/platformsdk/libipc_core.z.so(OHOS:BinderConnector:WriteBinder(unsigned long,void*)+56)
#07 pc 000265a5 /system/lib/platformsdk/libipc_core.z.so(OHOS:BinderInvoker:TransactWithDriver(bool)+216)
#08 pc 0002666f /system/lib/platformsdk/libipc_core.z.so(OHOS:BinderInvoker:StartWorkLoop()+18)
#09 pc 000270a9 /system/lib/platformsdk/libipc_core.z.so(OHOS:BinderInvoker:JoinThread(bool)+32)
#10 pc 00023783 /system/lib/platformsdk/libipc_core.z.so(OHOS:IPCWorkThread:ThreadHandler(void*)+290)
#11 pc 0007b4d9 /system/lib/platformsdk/libeventhandler.z.so
#12 pc 00072829 /system/lib/platformsdk/libeventhandler.z.so
#13 pc 00071841 /system/lib/platformsdk/libeventhandler.z.so(OHOS:AppExecFwk:EventRunner:Run()+64)
#14 pc 00094a8b /system/lib/libappkit_native.z.so(OHOS:AppExecFwk:MainThread:Start()+278)

Tid:1563,Name:IPC_0_1563
#00 pc 0009392c /system/lib/ld-musl-arm.so.1(ioctl+72)
#01 pc 00025779 /system/lib/platformsdk/libipc_core.z.so(OHOS:BinderConnector:WriteBinder(unsigned long,void*)+56)
cpuusage信息示例:
整机CPU信息。
Load average: 2.87 / 1.45 / 0.58; the cpu load average in 1 min,5 min and 15 min
CPU usage from 2023-03-10 17:06:53 to 2023-03-10 17:06:53
Total: 29%; User Space: 28%; Kernel Space: 1%; iowait: 6%; irq: 0%; idle: 62%
Details of Processes:
    PID     Total Usage     User Space     Kernel Space     Page Fault Minor     Page Fault Major      Name
    1561       23%            23%              0%               9985                  26            i.myapplication
    527        1%             1%               0%               3046                  9             hidumper_servic
    242        1%             1%               0%               69799                 280           hiview
memory信息示例:
当前进程内存信息。
-------------------------------------------[memory]----------------------------------------
                 Pss      Shared   Shared   Private  Private   Swap   SwapPss   Heap  Heap
                 Total    CLean    Dirty    CLean    Dirty     Total  Total     Size  Alloc
                 (kB)     (kB)     (kB)     (kB)      (kB)     (kB)    (kB)     (kB)  (kB)
-------------------------------------------------------------------------------------------
guard             0        0         0       0         0         0      0        0      0
native heap      185       0        180      0        160        0      0        0      0
AnonPage other   17881    12        12376    88       15948      0      0        0      0
stack            292       0        0        0        292        0      0        0      0
.S0              5053     63408     4172     1812     2640       0      0        0      0
.ttf             1133     3092      0        4        0          0      0        0      0
dev              10       0         108      8        0          0      0        0      0
FilePage other   121      556       8        0        4          0      0        0      0
------------------------------------------------------------------------------------------
Total            34675    67068     16844    1912     19044      0      0        0      0
日志主干特异性信息(应用主线程卡死超时)
Reason是THREAD_BLOCK_6S的日志。根据应用主线程卡死超时的原理可知,THREAD_BLOCK由THREAD_BLOCK_3S和THREAD_BLOCK_6S组成。将两部分日志对比分析,可更准确的判断是卡死还是执行任务过多造成无法响应的情况。
在日志的前部分写入THREAD_BLOCK_3S,随后写入THREAD_BLOCK_6S。可以通过搜索EVENTNAME字段来定位两个事件在日志中的位置。
两个事件均包含MSG字段,该字段记录了应用主线程卡死超时时主线程处理队列的信息。通过对比MSG字段,可以查看两个时间点中主线程事件处理队列的排队情况。
以下示例日志显示,在07:22:40.931时,VIP priority的队列中的事件一直在处理,同时THREAD_BLOCK_3S和THREAD_BLOCK_6S的队列也存在该事件。这说明主线程卡死并非由于任务过多。
由于THREAD_BLOCK_6S是主线程卡死,因此只需要关注主线程的堆栈(主线程线程号跟进程号相同)。以下示例日志中显示,主线程堆栈从ArkUI控件到JS运行,表明卡死在JS代码中。3S和6S堆栈位置相同,说明JS有卡死,但并非由于任务过多。
THREAD_BLOCK_3S:
start time: 2017/08/17-19:22:42:022
DOMAIN = AAFWK
EVENTNAME = THREAD_BLOCK_3S
TIMESTAMP = 2017/08/17-19:22:42:10
PID = 2212
UID = 20010044
TID = 2212
PACKAGE_NAME = com.example.freeze
PROCESS_NAME = com.example.freeze
eventLog_action = ffrt,t,GpuStack,cmd:m,hot
eventLog_interval = 10
MSG =
Fault time:2017/08/17-19:22:40
App main thread is not response!

Main handler dump start time: 2017-08-17 19:22:40.932
mainHandler dump is:
 EventHandler dump begin curTime: 2017-08-17 07:22:40.932
 Event runner (Thread name = , Thread ID = 2212) is running
 Current Running: start at 2017-08-17 07:22:34.930, Event { send thread = 2212, send time = 2017-08-17 07:22:29.932, handle time = 2017-08-17 07:22:34.929, trigger time = 2017-08-17 07:22:34.930, task name = uv_timer_task, caller = [ohos_loop_handler.cpp(OnTriggered:72)] }
 History event queue information:
 No. 0 : Event { send thread = 2212, send time = 2017-08-17 07:22:29.864, handle time = 2017-08-17 07:22:29.864, trigger time = 2017-08-17 07:22:29.864, completeTime time = 2017-08-17 07:22:29.865, priority = VIP, task name = MMITask }
 No. 1 : Event { send thread = 2212, send time = 2017-08-17 07:22:29.814, handle time = 2017-08-17 07:22:29.865, trigger time = 2017-08-17 07:22:29.865, completeTime time = 2017-08-17 07:22:29.865, priority = Low, task name = ArkUIIdleTask }
 No. 2 : Event { send thread = 2212, send time = 2017-08-17 07:22:29.869, handle time = 2017-08-17 07:22:29.869, trigger time = 2017-08-17 07:22:29.869, completeTime time = 2017-08-17 07:22:29.870, priority = VIP, task name = MMITask }
 ......
 VIP priority event queue information:
 No.1 : Event { send thread = 2486, send time = 2017-08-17 07:22:37.931, handle time = 2017-08-17 07:22:37.931, id = 1, caller = [watchdog.cpp(Timer:208)] }
 No.2 : Event { send thread = 2486, send time = 2017-08-17 07:22:40.931, handle time = 2017-08-17 07:22:40.931, id = 1, caller = [watchdog.cpp(Timer:208)] }
 Total size of VIP events : 2
 Immediate priority event queue information:
 Total size of Immediate events : 0
 High priority event queue information:
 Total size of High events : 0
 Low priority event queue information:
 Total size of Low events : 0
 Idle priority event queue information:
 Total size of Idle events : 0
 Total event size : 2
Main handler dump end time: 2017-08-17 19:22:40.934

Catche stack trace start time: 2017-08-17 19:22:41.098

Tid:2212, Name:.example.freeze
#00 pc 001d0d1e /system/lib/platformsdk/libark_jsruntime.so(panda::BytecodeInst<(panda::BytecodeInstMode)0>::Size(panda::BytecodeInst<(panda::BytecodeInstMode)0>::Format)+6)(ec51476a00bfde9c6d68b983a483d1ee)
#01 pc 0024b011 /system/lib/platformsdk/libark_jsruntime.so(panda::ecmascript::EcmaInterpreter::RunInternal(panda::ecmascript::JSThread*, unsigned char const*, unsigned long long*)+1824)(ec51476a00bfde9c6d68b983a483d1ee)
#02 pc 0024a75d /system/lib/platformsdk/libark_jsruntime.so(panda::ecmascript::EcmaInterpreter::Execute(panda::ecmascript::EcmaRuntimeCallInfo*)+1084)(ec51476a00bfde9c6d68b983a483d1ee)
#03 pc 002e78e5 /system/lib/platformsdk/libark_jsruntime.so(panda::ecmascript::JSFunction::Call(panda::ecmascript::EcmaRuntimeCallInfo*)+392)(ec51476a00bfde9c6d68b983a483d1ee)
#04 pc 00427fbb /system/lib/platformsdk/libark_jsruntime.so(panda::FunctionRef::CallForNapi(panda::ecmascript::EcmaVM const*, panda::JSValueRef*, panda::JSValueRef* const*, int)+1382)(ec51476a00bfde9c6d68b983a483d1ee)
#05 pc 000502a1 /system/lib/platformsdk/libace_napi.z.so(napi_call_function+156)(394b2e21899459da15b9fe3f1c3188f0)
......
THREAD_BLOCK_6S:
start time: 2017/08/17-19:22:44:962
DOMAIN = AAFWK
EVENTNAME = THREAD_BLOCK_6S
TIMESTAMP = 2017/08/17-19:22:44:952
PID = 2212
UID = 20010044
TID = 2212
PACKAGE_NAME = com.example.freeze
PROCESS_NAME = com.example.freeze
eventLog_action = t,cmd:c,cmd:cci,cmd:m,cmd:dam,tr,k:SysRqFile,hot
eventLog_interval = 10
MSG =
Fault time:2017/08/17-19:22:43
App main thread is not response!

Main handler dump start time: 2017-08-17 19:22:43.932
mainHandler dump is:
 EventHandler dump begin curTime: 2017-08-17 07:22:43.932
 Event runner (Thread name = , Thread ID = 2212) is running
 Current Running: start at 2017-08-17 07:22:34.930, Event { send thread = 2212, send time = 2017-08-17 07:22:29.933, handle time = 2017-08-17 07:22:34.930, trigger time = 2017-08-17 07:22:34.930, task name = uv_timer_task, caller = [ohos_loop_handler.cpp(OnTriggered:72)] }
 History event queue information:
 No. 0 : Event { send thread = 2212, send time = 2017-08-17 07:22:29.864, handle time = 2017-08-17 07:22:29.864, trigger time = 2017-08-17 07:22:29.864, completeTime time = 2017-08-17 07:22:29.865, priority = VIP, task name = MMITask }
 No. 1 : Event { send thread = 2212, send time = 2017-08-17 07:22:29.814, handle time = 2017-08-17 07:22:29.865, trigger time = 2017-08-17 07:22:29.865, completeTime time = 2017-08-17 07:22:29.865, priority = Low, task name = ArkUIIdleTask }
 No. 2 : Event { send thread = 2212, send time = 2017-08-17 07:22:29.869, handle time = 2017-08-17 07:22:29.869, trigger time = 2017-08-17 07:22:29.870, completeTime time = 2017-08-17 07:22:29.870, priority = VIP, task name = MMITask }
 .......
 VIP priority event queue information:
 No.1 : Event { send thread = 2486, send time = 2017-08-17 07:22:37.931, handle time = 2017-08-17 07:22:37.931, id = 1, caller = [watchdog.cpp(Timer:208)] }
 No.2 : Event { send thread = 2486, send time = 2017-08-17 07:22:40.931, handle time = 2017-08-17 07:22:40.931, id = 1, caller = [watchdog.cpp(Timer:208)] }
 No.3 : Event { send thread = 2486, send time = 2017-08-17 07:22:43.932, handle time = 2017-08-17 07:22:43.932, id = 1, caller = [watchdog.cpp(Timer:208)] }
 Total size of VIP events : 3
 Immediate priority event queue information:
 Total size of Immediate events : 0
 High priority event queue information:
 Total size of High events : 0
 Low priority event queue information:
 Total size of Low events : 0
 Idle priority event queue information:
 Total size of Idle events : 0
 Total event size : 3
Main handler dump end time: 2017-08-17 19:22:43.934

Catche stack trace start time: 2017-08-17 19:22:44.061

Tid:2212, Name:.example.freeze
#00 pc 0024afea /system/lib/platformsdk/libark_jsruntime.so(panda::ecmascript::EcmaInterpreter::RunInternal(panda::ecmascript::JSThread*, unsigned char const*, unsigned long long*)+1786)(ec51476a00bfde9c6d68b983a483d1ee)
#01 pc 0024a75d /system/lib/platformsdk/libark_jsruntime.so(panda::ecmascript::EcmaInterpreter::Execute(panda::ecmascript::EcmaRuntimeCallInfo*)+1084)(ec51476a00bfde9c6d68b983a483d1ee)
#02 pc 002e78e5 /system/lib/platformsdk/libark_jsruntime.so(panda::ecmascript::JSFunction::Call(panda::ecmascript::EcmaRuntimeCallInfo*)+392)(ec51476a00bfde9c6d68b983a483d1ee)
#03 pc 00427fbb /system/lib/platformsdk/libark_jsruntime.so(panda::FunctionRef::CallForNapi(panda::ecmascript::EcmaVM const*, panda::JSValueRef*, panda::JSValueRef* const*, int)+1382)(ec51476a00bfde9c6d68b983a483d1ee)
#04 pc 000502a1 /system/lib/platformsdk/libace_napi.z.so(napi_call_function+156)(394b2e21899459da15b9fe3f1c3188f0)
......
结合流水日志,查看当前应用执行的代码部分。
通常可以查看通用日志信息内容,判断是否存在以下情况:对端通信卡死、整机CPU消耗过高导致当前应用响应迟缓、内存泄漏或内存不足导致任务无法运行。
日志主干特异性信息(用户输入响应超时)
Reason是APP_INPUT_BLOCK的日志,表明用户点击事件超过5s没有得到反馈。
MSG信息是这个事件的说明:用户的输入未得到响应。
APP_INPUT_BLOCK的日志信息可以参考通用日志信息进行分析。需特别说明的是,用户输入无响应时,主线程通常会卡死。可以结合日志堆栈和BinderCatcher信息分析。如果没有主线程卡死的日志,说明在输入事件之前可能存在大量细碎的其他事件,这些事件不足以导致主线程卡死,但数量较多,影响用户的输入事件的响应。
日志主干特异性信息(生命周期切换超时)
Reason是LIFECYCLE_TIMEOUT的日志。与上文THREAD_BLOCK_6S和THREAD_BLOCK_3S一样有两个事件:LIFECYCLE_HALF_TIMEOUT和LIFECYCLE_TIMEOUT。
示例中的MSG说明表示生命周期超时类型。
示例显示LIFECYCLE_TIMEOUT的原因是Ability后台切换超时,可按照生命周期切换超时的超时时间来找流水日志等信息。
LIFECYCLE_TIMEOUT:
DOMAIN:AAFWK
STRINGID:LIFECYCLE
TIMEOUT TIMESTAMP:2023/03/10-17:06:53:65
PID:1561
UID:20010039
PACKAGE_NAME:com.example.myapplication
PROCESS_NAME:com.example.myapplication
MSG:ability:EntryAbility background timeout
参考通用日志信息分析其他日志信息。特别说明:大多数情况下,生命周期切换时主线程会卡死。可以结合两个日志的堆栈和BinderCatcher信息对比查看。
应用退出
当应用发生以下故障时,为了保证可恢复,会杀死应用。
| 故障类型 | 说明 |
|---|---|
| THREAD_BLOCK_6S | 应用主线程卡死超时。 |
| APP_INPUT_BLOCK | 用户输入响应超时。 |
| LIFECYCLE_TIMEOUT | Ability生命周期切换超时。 |
定位步骤与思路
定位应用无响应问题,首先需要开发者获取相关日志,再根据日志记录的问题基本信息,结合hilog日志和trace来定位出无响应问题的发生的具体位置。
获取日志
应用无响应日志是一种故障日志,与Native进程崩溃、JS应用崩溃、系统进程异常等都由FaultLog模块管理,可通过以下方式获取日志:
方式一:通过DevEco Studio获取日志。
DevEco Studio会收集设备故障日志并归档到FaultLog下。具体可参考DevEco Studio使用指南-FaultLog。
方式二:通过hiAppEvent接口订阅。
hiAppEvent提供了故障订阅接口,可以订阅各类故障打点,详见HiAppEvent介绍。
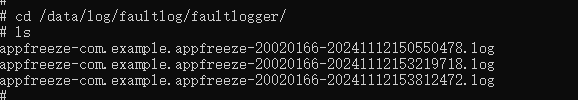
方式三:设备ROOT模式下通过shell获取日志。
应用无响应日志以appfreeze-开头,生成在设备“/data/log/faultlog/faultlogger/”路径下。文件名格式为“appfreeze-应用包名-应用UID-毫秒级时间.log”。
确认基本信息
获取直接卡死应用的进程号,是否处于前台等基础信息
Generated by HiviewDFX@OpenHarmony
============================================================
Device info:HUANEI Mate 60 Pro
Build info:ALN-AL00 x.x.x.xx(XXXXXXX)
Fingerprint:ef8bd28f8b57b54656d743b546efa73764c77866a65934bd96f2678f886813b7
Module name:com.xxx.xxx
Version:1.2.2.202
VersionCode:1002002202
PreInstalled:Yes
Foreground:No   --> 是否处于前台
Pid:15440
Uid:20020029
Reason:THREAD BLOCK 6S
appfreeze: com.xxx.xxx THREAD_BLOCK 6S at 20240410164052
DisplayPowerInfo:powerState: AWAKE
>>>>>>>>>>>>>>>>>>>>>>>>>>>>>>>>>>>>>>>>>>>
获取故障发生时间点
故障上报时间点。
>>>>>>>>>>>>>>>>>>>>>>>>>>>>>>>>>>>>>>>>
DOMAIN:AAFWK
STRINGID: THREAD BLOCK 6S
TIMESTAMP: 2024/04/10-16:40:52:743   --> 故障上报时间戳
PID:15440
UID:20020029
PACKAGE NAME:com.xxx.xxx
PROCESS NAME:com.xxx.xxx
****************************************
不同故障类型的不同场景下的检测时长汇总表格。
| THREAD_BLOCK_6S | APP_INPUT_BLOCK | LIFECYCLE_TIMEOUT |
|---|---|---|
| 前台应用:6s 后台应用 :3s * 5 + 6s = 21s |
5s | Load:10s Active:5s Inactive:0.5s Terminate:10s Connect:3s Disconnect:0.5s Restart:5s Foreground:5s Background:3s |
说明:
1、THREAD_BLOCK_3S/LIFECYCLE_HALF_TIMEOUT的检测时长是相应THREAD_BLOCK_6S/LIFECYCLE_TIMEOUT的一半,warning级别,不会单独上报日志;THREAD_BLOCK_6S/LIFECYCLE_TIMEOUT是error级别,整合了本身和其一半检测时长故障的日志一同上报;
2、前台应用发生THREAD_BLOCK_3S后,即可触发后续THREAD_BLOCK_6S事件;
3、后台应用存在计数器 backgroundReportCount_,初始化或主线程卡死恢复时赋值为0,当发THREAD_BLOCK事件后,判断计数器是否达到5决定此次事件是否继续上报(大于等于5就进行上报),判断之后计数器均加1。可知后台应用THREAD_BLOCK_3S与THREAD_BLOCK_6S检测时长依次为18s与21s。
根据故障上报时间,向前推检测时长,可得到故障发生的具体时间。
查看 eventHandler 信息
开发者可以通过“mainHandler dump is”关键字搜索日志中的eventHandler dump信息。
1、dump begin curTime & Current Running。
mainHandler dump is:
 EventHandler dump begin curTime: 2024-08-08 12:17:43.544      --> 开始 dump 时间
 Event runner (Thread name = , Thread ID = 35854) is running   --> 正在运行的线程信息
 Current Running: start at 2024-08-08 12:17:16.629, Event { send thread = 35882, send time = 2024-08-08 12:17:16.628,  handle time = 2024-08-08 12:17:16.629, trigger time = 2024-08-08 12:17:16.630, task name = , caller = xx }
 --> trigger time--> 任务开始运行的时间
当前任务运行时长 = dump begin curTime - trigger time, 如示例中当前任务运行时长达到27s。
若任务运行时长 > 故障检测时长,表示当前正在运行的任务可能导致应用卡死,需排查该任务。
若任务运行时长较小,表示当前任务仅是检测时间区间内主线程运行的任务之一,主要耗时不一定是该任务,建议优先查看近期耗时最长任务(History event queue information中)。该情形多为线程繁忙导致的watchdog无法调度执行。
2、 History event queue information。
 Current Running: start at 2024-08-08 12:17:16.629, Event { send thread = 35882, send time = 2024-08-08 12:17:16.628, handle time = 2024-08-08 12:17:16.629, trigger time = 2024-08-08 12:17:16.630, task name = , caller = [extension_ability_thread.cpp(ScheduleAbilityTransaction:393)]}
 History event queue information:
 No. 0 : Event { send thread = 35854, send time = 2024-08-08 12:17:15.525, handle time = 2024-08-08 12:17:15.525, trigger time = 2024-08-08 12:17:15.527, completeTime time = 2024-08-08 12:17:15.528, priority = High, id = 1 }
 No. 1 : Event { send thread = 35854, send time = 2024-08-08 12:17:15.525, handle time = 2024-08-08 12:17:15.525, trigger time = 2024-08-08 12:17:15.527, completeTime time = 2024-08-08 12:17:15.527, priority = Low, task name = MainThread:SetRunnerStarted }
 No. 2 : Event { send thread = 35856, send time = 2024-08-08 12:17:15.765, handle time = 2024-08-08 12:17:15.765, trigger time = 2024-08-08 12:17:15.766, completeTime time = 2024-08-08 12:17:15.800, priority = Low, task name = MainThread:LaunchApplication }
 No. 3 : Event { send thread = 35856, send time = 2024-08-08 12:17:15.767, handle time = 2024-08-08 12:17:15.767, trigger time = 2024-08-08 12:17:15.800, completeTime time = 2024-08-08 12:17:16.629, priority = Low, task name = MainThread:LaunchAbility }
 No. 4 : Event { send thread = 35854, send time = 2024-08-08 12:17:15.794, handle time = 2024-08-08 12:17:15.794, trigger time = 2024-08-08 12:17:16.629, completeTime time = 2024-08-08 12:17:16.629, priority = IDEL, task name = IdleTime:PostTask }
 No. 5 : Event { send thread = 35852, send time = 2024-08-08 12:17:16.629, handle time = 2024-08-08 12:17:16.629, trigger time = 2024-08-08 12:17:16.629, completeTime time = , priority = Low, task name =  }
可以从历史任务队列中寻找故障发生时间区间内较为耗时的任务。其中CompleteTime time为空的任务是当前任务。
任务运行耗时 = CompleteTime time - trigger time。
筛选出耗时较高的任务,排查其运行情况。
3、VIP priority event queue information。
 VIP priority event queue information:
 No.1 : Event { send thread = 2486, send time = 2017-08-17 07:22:37.931, handle time = 2017-08-17 07:22:37.931, id = 1, caller = [watchdog.cpp(Timer:208)] }
 No.2 : Event { send thread = 2486, send time = 2017-08-17 07:22:40.931, handle time = 2017-08-17 07:22:40.931, id = 1, caller = [watchdog.cpp(Timer:208)] }
 No.3 : Event { send thread = 2486, send time = 2017-08-17 07:22:43.932, handle time = 2017-08-17 07:22:43.932, id = 1, caller = [watchdog.cpp(Timer:208)] }
 ...
watchdog任务位于优先级队列中,观察发现该任务的发送时间间隔约为3s。
对比其他优先级事件,观察watchdog任务在队列中的移动情况。
为保障第一时间响应用户,用户输入事件传递链中的任务都属于高优先级任务。此任务事件队列均由系统创建,通常记录用户输入->屏幕->窗口->ArkUI->应用的传输过程,与三方应用事件无关,开发者无需额外关注。
 VIP priority event queue information:
 No. 1 : Event { send thread = 35862, send time = 2024-08-08 12:17:25.526, handle time = 2024-08-08 12:17:25.526, id = 1, caller = [watchdog.cpp(Timer:156)]}
 No. 2 : Event { send thread = 35862, send time = 2024-08-08 12:17:28.526, handle time = 2024-08-08 12:17:28.526, id = 1, caller = [watchdog.cpp(Timer:156)]}
 No. 3 : Event { send thread = 35862, send time = 2024-08-08 12:17:31.526, handle time = 2024-08-08 12:17:31.526, id = 1, caller = [watchdog.cpp(Timer:156)]}
 No. 4 : Event { send thread = 35862, send time = 2024-08-08 12:17:34.530, handle time = 2024-08-08 12:17:34.530, id = 1, caller = [watchdog.cpp(Timer:156)]}
 No. 5 : Event { send thread = 35862, send time = 2024-08-08 12:17:37.526, handle time = 2024-08-08 12:17:37.526, id = 1, caller = [watchdog.cpp(Timer:156)]}
 No. 6 : Event { send thread = 35862, send time = 2024-08-08 12:17:40.526, handle time = 2024-08-08 12:17:40.526, id = 1, caller = [watchdog.cpp(Timer:156)]}
 No. 7 : Event { send thread = 35862, send time = 2024-08-08 12:17:43.544, handle time = 2024-08-08 12:17:43.544 ,id = 1, caller = [watchdog.cpp(Timer:156)]}
 Total size of High events : 7
warning:
 VIP priority event queue information:
 No. 1 : Event { send thread = 35862, send time = 2024-08-08 12:17:25.526, handle time = 2024-08-08 12:17:25.526, id = 1, caller = [watchdog.cpp(Timer:156)]}
 No. 2 : Event { send thread = 35862, send time = 2024-08-08 12:17:28.526, handle time = 2024-08-08 12:17:28.526, id = 1, caller = [watchdog.cpp(Timer:156)]}
 No. 3 : Event { send thread = 35862, send time = 2024-08-08 12:17:31.526, handle time = 2024-08-08 12:17:31.526, id = 1, caller = [watchdog.cpp(Timer:156)]}
 No. 4 : Event { send thread = 35862, send time = 2024-08-08 12:17:34.530, handle time = 2024-08-08 12:17:34.530, id = 1, caller = [watchdog.cpp(Timer:156)]}
 Total size of High events : 4
block:
 VIP priority event queue information:
 No. 1 : Event { send thread = 35862, send time = 2024-08-08 12:17:25.526, handle time = 2024-08-08 12:17:25.526, id = 1, caller = [watchdog.cpp(Timer:156)]}
 No. 2 : Event { send thread = 35862, send time = 2024-08-08 12:17:28.526, handle time = 2024-08-08 12:17:28.526, id = 1, caller = [watchdog.cpp(Timer:156)]}
 No. 3 : Event { send thread = 35862, send time = 2024-08-08 12:17:31.526, handle time = 2024-08-08 12:17:31.526, id = 1, caller = [watchdog.cpp(Timer:156)]}
 No. 4 : Event { send thread = 35862, send time = 2024-08-08 12:17:34.530, handle time = 2024-08-08 12:17:34.530, id = 1, caller = [watchdog.cpp(Timer:156)]}
 No. 5 : Event { send thread = 35862, send time = 2024-08-08 12:17:37.526, handle time = 2024-08-08 12:17:37.526, id = 1, caller = [watchdog.cpp(Timer:156)]}
  Total size of High events : 5
以上示例中可发现block队列比于warning队列更长,而对应的第一个任务没有发生变化,可能存在两种情况:
- 当前正在运行的任务卡死阻塞,导致其他任务一直未被调度执行;
- 更高优先级队列中任务堆积,导致位于较低优先级队列中的watchdog任务未被调度执行。
查看 stack 信息
通过得到的Pid、Tid查看对应的stack,存在以下几种情况:
1、有明确的卡死堆栈信息。
Tid:3025, Name: xxx
# 00 pc 00000000001b4094 /system/lib/ld-musl-aarch64.so.1(__timedwait_cp+188)(b168f10a179cf6050a309242262e6a17)
# 01 pc 00000000001b9fc8 /system/lib/ld-musl-aarch64.so.1(__pthread_mutex_timedlock_inner+592)(b168f10a179cf6050a309242262e6a17)
# 02 pc 00000000000c3e40 /system/lib64/libc++.so(std::__h::mutex::lock()+8)(9cbc937082b3d7412696099dd58f4f78242f9512) --> 等锁卡死
# 03 pc 000000000007ac4c /system/lib64/platformsdk/libnative_rdb.z.so(OHOS::NativeRdb::SqliteConnectionPool::Container::Release(std::__h::shared_ptr<OHOS::NativeRdb::SqliteConnectionPool::ConnNode>)+60)(5e8443def4695e8c791e5f847035ad9f)
# 04 pc 000000000007aaf4 /system/lib64/platformsdk/libnative_rdb.z.so(OHOS::NativeRdb::SqliteConnectionPool::ReleaseNode(std::__h::shared_ptr<OHOS::NativeRdb::SqliteConnectionPool::ConnNode>)+276)(5e8443def4695e8c791e5f847035ad9f)
# 05 pc 000000000007a8c0 /system/lib64/platformsdk/libnative_rdb.z.so(5e8443def4695e8c791e5f847035ad9f)
# 06 pc 00000000000b36ec /system/lib64/platformsdk/libnative_rdb.z.so(OHOS::NativeRdb::SqliteSharedResultSet::Close()+324)(5e8443def4695e8c791e5f847035ad9f)
# 07 pc 000000000006da94 /system/lib64/module/data/librelationalstore.z.so(OHOS::RelationalStoreJsKit::ResultSetProxy::Close(napi_env__*, napi_callback_info__*) (.cfi)+212)(5c7c67512e12e0e53fd23e82ee576a88)
# 08 pc 0000000000034408 /system/lib64/platformsdk/libace_napi.z.so(panda::JSValueRef ArkNativeFunctionCallBack<true>(panda::JsiRuntimeCallInfo*)+220)(f271f536a588ef9d0dc5328c70fce511)
# 09 pc 00000000002d71d0 /system/lib64/module/arkcompiler/stub.an(RTStub_PushCallArgsAndDispatchNative+40)
# 10 at parseResultSet (entry/build/default/cache/default/default@CompileArkTS/esmodule/release/datamanager/datawrapper/src/main/ets/database/RdbManager.ts:266:1)
# 11 at query (entry/build/default/cache/default/default@CompileArkTS/esmodule/release/datamanager/datawrapper/src/main/ets/database/RdbManager.ts:188:1)
so明确等锁卡死,通过反编译获取对应代码行,排查代码上下文解决bug。
故障调用栈支持Native栈帧和JS栈帧,以上堆栈中第10、11层堆栈是JS栈帧。具体格式如下:
# 10 at parseResultSet (entry/build/default/cache/default/default@CompileArkTS/esmodule/release/datamanager/datawrapper/src/main/ets/database/RdbManager.ts:266:1)
            ^                                                                                                                                       ^
          函数名                                                                                                                                文件行列号位置
2、卡在ipc请求。
Tid:53616, Name:xxx
# 00 pc 0000000000171c1c /system/lib/ld-musl-aarch64.so.1(ioctl+176)(b168f10a179cf6050a309242262e6a17)
# 01 pc 0000000000006508 /system/lib64/chipset-pub-sdk/libipc_common.z.so(OHOS::BinderConnector::WriteBinder(unsigned long, void*)+100)(1edec25445c569dd1093635c1da3bc0a) --> binder 卡死
# 02 pc 000000000004d500 /system/lib64/platformsdk/libipc_core.z.so(OHOS::BinderInvoker::TransactWithDriver(bool)+296)(6151eca3b47aa2ab3e378e6e558b90f3)
# 03 pc 000000000004c6c0 /system/lib64/platformsdk/libipc_core.z.so(OHOS::BinderInvoker::WaitForCompletion(OHOS::MessageParcel*, int*)+128)(6151eca3b47aa2ab3e378e6e558b90f3)
# 04 pc 000000000004c304 /system/lib64/platformsdk/libipc_core.z.so(OHOS::BinderInvoker::SendRequest(int, unsigned int, OHOS::MessageParcel&, OHOS::MessageParcel&, OHOS::MessageOption&)+348)(6151eca3b47aa2ab3e378e6e558b90f3)
# 05 pc 00000000000319ac /system/lib64/platformsdk/libipc_core.z.so(OHOS::IPCObjectProxy::SendRequestInner(bool, unsigned int, OHOS::MessageParcel&, OHOS::MessageParcel&, OHOS::MessageOption&)+124)(6151eca3b47aa2ab3e378e6e558b90f3)
# 06 pc 0000000000031cfc /system/lib64/platformsdk/libipc_core.z.so(OHOS::IPCObjectProxy::SendRequest(unsigned int, OHOS::MessageParcel&, OHOS::MessageParcel&, OHOS::MessageOption&)+184)(6151eca3b47aa2ab3e378e6e558b90f3)
# 07 pc 0000000000023c7c /system/lib64/libipc.dylib.so(<ipc::remote::obj::RemoteObj>::send_request+268)(7006cb5520edc22f64d04df86cb90152)
# 08 pc 000000000000b904 /system/lib64/libasset_sdk.dylib.so(<asset_sdk::Manager>::send_request+48)(4073ec22b58b83f79883d5fc8102ce77)
# 09 pc 000000000000b600 /system/lib64/libasset_sdk.dylib.so(<asset_sdk::Manager>::query+156)(4073ec22b58b83f79883d5fc8102ce77)
# 10 pc 0000000000006d94 /system/lib64/libasset_sdk_ffi.z.so(query_asset+116)(9a309896092ba014c878289a54688679)
# 11 pc 0000000000006740 /system/lib64/module/security/libasset_napi.z.so((anonymous namespace)::NapiQuerySync(napi_env__*, napi_callback_info__*) (.cfi)+220)(ef7afe850712e4822f085ed0ac184e8a)
# 12 pc 0000000000034408 /system/lib64/platformsdk/libace_napi.z.so(panda::JSValueRef ArkNativeFunctionCallBack<true>(panda::JsiRuntimeCallInfo*)+220)(f271f536a588ef9d0dc5328c70fce511)
3、warning/error栈一致,栈顶为业务同步执行代码。
warning/error栈均为:
Tid:14727, Name:xxx
# 00 pc 00000000001c4c60 /system/lib/ld-musl-aarch64.so.1(pread+72)(b168f10a179cf6050a309242262e6a17)
# 01 pc 0000000000049154 /system/lib64/platformsdk/libsqlite.z.so(unixRead+180)(48485aa23da681fc87d8dc0b4be3e34c)
# 02 pc 0000000000053e98 /system/lib64/platformsdk/libsqlite.z.so(readDbPage+116)(48485aa23da681fc87d8dc0b4be3e34c)
# 03 pc 0000000000053d48 /system/lib64/platformsdk/libsqlite.z.so(getPageNormal+864)(48485aa23da681fc87d8dc0b4be3e34c)
# 04 pc 00000000000757a0 /system/lib64/platformsdk/libsqlite.z.so(getAndInitPage+216)(48485aa23da681fc87d8dc0b4be3e34c)
# 05 pc 0000000000077658 /system/lib64/platformsdk/libsqlite.z.so(moveToLeftmost+164)(48485aa23da681fc87d8dc0b4be3e34c)
# 06 pc 000000000006aa34 /system/lib64/platformsdk/libsqlite.z.so(sqlite3VdbeExec+34532)(48485aa23da681fc87d8dc0b4be3e34c)
# 07 pc 000000000002e424 /system/lib64/platformsdk/libsqlite.z.so(sqlite3_step+644)(48485aa23da681fc87d8dc0b4be3e34c)
# 08 pc 00000000000b1a70 /system/lib64/platformsdk/libnative_rdb.z.so(FillSharedBlockOpt+408)(5e8443def4695e8c791e5f847035ad9f)
# 09 pc 0000000000082a94 /system/lib64/platformsdk/libnative_rdb.z.so(OHOS::NativeRdb::SqliteStatement::FillBlockInfo(OHOS::NativeRdb::SharedBlockInfo*) const+76)(5e8443def4695e8c791e5f847035ad9f)
# 10 pc 00000000000b4214 /system/lib64/platformsdk/libnative_rdb.z.so(OHOS::NativeRdb::SqliteSharedResultSet::ExecuteForSharedBlock(OHOS::AppDataFwk::SharedBlock*, int, int, bool)+236)(5e8443def4695e8c791e5f847035ad9f)
结合trace进一步确认,排查调用的单一栈顶函数逻辑是否执行超时。
4、 瞬时栈,warning/error栈不一致。
warning栈:
Tid:3108, Name:xxx
# 00 pc 0000000000146e2c /system/lib/ld-musl-aarch64.so.1(open64+224)(b168f10a179cf6050a309242262e6a17)
# 01 pc 0000000000014600 /system/lib64/chipset-pub-sdk/libextractortool.z.so(OHOS::AbilityBase::ZipFileReader::init()+600)(c4893935af8fc8cb36569be5ccdebfa9)
# 02 pc 0000000000014144 /system/lib64/chipset-pub-sdk/libextractortool.z.so(OHOS::AbilityBase::ZipFileReader::CreateZipFileReader(std::__h::basic_string<char, std::__h::char_traits<char>, std::__h::allocator<char>> const&)+392)(c4893935af8fc8cb36569be5ccdebfa9)
# 03 pc 000000000000f724 /system/lib64/chipset-pub-sdk/libextractortool.z.so(OHOS::AbilityBase::ZipFile::Open()+728)(c4893935af8fc8cb36569be5ccdebfa9)
# 04 pc 000000000000a808 /system/lib64/chipset-pub-sdk/libextractortool.z.so(OHOS::AbilityBase::Extractor::Init()+124)(c4893935af8fc8cb36569be5ccdebfa9)
# 05 pc 000000000000c4a4 /system/lib64/chipset-pub-sdk/libextractortool.z.so(OHOS::AbilityBase::ExtractorUtil::GetExtractor(std::__h::basic_string<char, std::__h::char_traits<char>, std::__h::allocator<char>> const&, bool&, bool)+596)(c4893935af8fc8cb36569be5ccdebfa9)
# 06 pc 00000000000391e4 /system/lib64/platformsdk/libglobal_resmgr.z.so(OHOS::Global::Resource::GetIndexData(char const*, std::__h::unique_ptr<unsigned char [], std::__h::default_delete<unsigned char []>>&, unsigned long&)+284)(5c4263e737507b4a8f2ee7196a152dbd)
# 07 pc 0000000000038590 /system/lib64/platformsdk/libglobal_resmgr.z.so(OHOS::Global::Resource::HapResource::LoadFromHap(char const*, std::__h::shared_ptr<OHOS::Global::Resource::ResConfigImpl>&, bool, bool, unsigned int const&)+80)(5c4263e737507b4a8f2ee7196a152dbd)
# 08 pc 00000000000384e8 /system/lib64/platformsdk/libglobal_resmgr.z.so(OHOS::Global::Resource::HapResource::Load(char const*, std::__h::shared_ptr<OHOS::Global::Resource::ResConfigImpl>&, bool, bool, unsigned int const&)+364)(5c4263e737507b4a8f2ee7196a152dbd)
# 09 pc 000000000002f118 /system/lib64/platformsdk/libglobal_resmgr.z.so(OHOS::Global::Resource::HapManager::AddResourcePath(char const*, unsigned int const&)+280)(5c4263e737507b4a8f2ee7196a152dbd)
# 10 pc 000000000002efdc /system/lib64/platformsdk/libglobal_resmgr.z.so(OHOS::Global::Resource::HapManager::AddResource(char const*, unsigned int const&)+52)(5c4263e737507b4a8f2ee7196a152dbd)
error栈:
Tid:3108, xxx
# 00 pc 00000000003e13cc /system/lib64/platformsdk/libark_jsruntime.so(panda::ecmascript::JSObject::GetProperty(panda::ecmascript::JSThread*, panda::ecmascript::JSHandle<panda::ecmascript::JSTaggedValue> const&, panda::ecmascript::JSHandle<panda::ecmascript::JSTaggedValue> const&, panda::ecmascript::JSShared::SCheckMode)+164)(13376099388381a01b166c00a8af99fb)
# 01 pc 00000000003d5518 /system/lib64/platformsdk/libark_jsruntime.so(panda::ecmascript::JSIterator::IteratorStep(panda::ecmascript::JSThread*, panda::ecmascript::JSHandle<panda::ecmascript::JSTaggedValue> const&)+228)(13376099388381a01b166c00a8af99fb)
# 02 pc 0000000000570fa8 /system/lib64/platformsdk/libark_jsruntime.so(panda::ecmascript::RuntimeStubs::StArraySpread(unsigned long, unsigned int, unsigned long)+592)(13376099388381a01b166c00a8af99fb)
# 03 pc 00000000002d53c0 /system/lib64/module/arkcompiler/stub.an(RTStub_CallRuntime+40)
# 04 at doTask (product/phone/build/default/cache/default/default@CompileArkTS/esmodule/release/staticcommon/launchercommon/src/main/ets/db/RdbTaskPool.ts:1:1)
# 05 at update (product/phone/build/default/cache/default/default@CompileArkTS/esmodule/release/staticcommon/launchercommon/src/main/ets/db/RdbTaskPool.ts:1:1)
# 06 at updateAppNameByAbilityInfoAndType (product/phone/build/default/cache/default/default@CompileArkTS/esmodule/release/staticcommon/launchercommon/src/main/ets/db/RdbStoreManager.ts:12:1)
# 07 at anonymous (product/phone/build/default/cache/default/default@CompileArkTS/esmodule/release/staticcommon/launchercommon/src/main/ets/model/AppModel.ts:0:1)
# 08 pc 0000000000304a94 /system/lib64/platformsdk/libark_jsruntime.so(panda::ecmascript::InterpreterAssembly::Execute(panda::ecmascript::EcmaRuntimeCallInfo*)+144)(13376099388381a01b166c00a8af99fb)
# 09 pc 0000000000201d84 /system/lib64/platformsdk/libark_jsruntime.so(panda::ecmascript::builtins::BuiltinsPromiseJob::PromiseReactionJob(panda::ecmascript::EcmaRuntimeCallInfo*)+348)(13376099388381a01b166c00a8af99fb)
# 10 pc 00000000002d6e14 /system/lib64/module/arkcompiler/stub.an(RTStub_AsmInterpreterEntry+208)
此时栈是在线程的运行过程中捕获的,没有规律,说明线程未卡死;线程繁忙场景,需结合trace和hilog判断应用具体运行场景,针对该场景进行优化。
查看 binder 信息
binder信息抓取时机:存在半周期检测的故障类型是在warning事件产生后获取;其他故障在block事件后获取。
1、获取binder调用链。
PeerBinderCatcher -- pid==35854 layer_ == 1

BinderCatcher --

    35854:35854 to 52462:52462 code 3 wait:27.185154163 s frz_state:3,  ns:-1:-1 to -1:-1, debug:35854:35854 to 52462:52462, active_code:0 active_thread:0, pending_async_proc=0
    ...
    52462:52462 to 1386:0 code 13 wait:24.733640622 s frz_state:3,  ns:-1:-1 to -1:-1, debug:35854:35854 to 52462:52462, active_code:0 active_thread:0, pending_async_proc=0
async 1590:14743 to 1697:0 code 4 wait:124.733640622 s frz_state:1,  ns:-1:-1 to -1:-1, debug:1590:14743 to 1697:0, active_code:-1 active_thread:0, pending_async_proc=1590
    ...
以上示例中:从故障进程的主线程出发,存在35854:35854->52462:52462->1386:0的调用链关系,结合对端进程堆栈信息排查对端阻塞原因。
2、线程号为0。
表示该应用为IPC_FULL,即应用的ipc线程都在使用中,没有空闲线程分配来完成本次请求,导致阻塞,如上面示例中的1386进程,可参照其stack分析:
pid     context     request   started    max     ready   free_async_space

35862    binder      0          2        16       2         519984

35854    binder      0          2        16       3         520192

35850    binder      0          2        16       3         520192

13669    binder      0          1        16       3         520192

...

1386     binder      1          15       16       0         517264                 -> binderInfo

1474     binder      0          2        16       4         520192
可以看到1386进程处于ready态的线程数为0,验证了上述说法。此情况表明进程的其他ipc线程可能全部被阻塞,需要分析排查其他ipc线程不释放的原因。常见场景为:某一ipc线程持锁阻塞,导致其他线程等锁卡死。
另一种情况为free_async_space消耗殆尽,导致新的ipc线程没有足够的buffer空间完成请求。值得说明的是,同步和异步请求都会消耗该值,常见场景为:某短时间段内大批量异步请求。
3、waitTime过小。
waitTime表示的是本次ipc通信时长,如果该值远小于故障检测时长,则本次ipc请求并不是卡死的根本原因。 一种典型的场景是:应用侧主线程在短时间内多次ipc请求,总请求时长过长导致故障。
排查方向: - 单次请求是否在预期时长内(例如:规格在20ms的请求接口异常情形下达到1s),排查接口性能不达预期的原因。 - 应用测频繁调用场景是否合理。
4、无调用关系,栈为ipc栈。
确定是否为瞬时栈,即warning/block栈是否一致,可能场景:warning为ipc栈,block栈为其他瞬时栈,表明抓取binder时ipc请求已经结束,本次ipc请求耗时较短。 需要提到的是:binder信息并不是在发生故障时刻实时获取的,有一定的延迟性;对于存在半周期检测的故障类型来说,binder抓取比较准确,绝大多数都可以在故障时间段内完成采集;而其他故障类型在上报存在延迟的情况下可能抓取到非现场binder。
结合trace分析更能直观查看binder的耗时情况。
结合 hilog
DFX 相关日志
1、故障上报(reportEvent)。

2、抓栈(signal:35)。
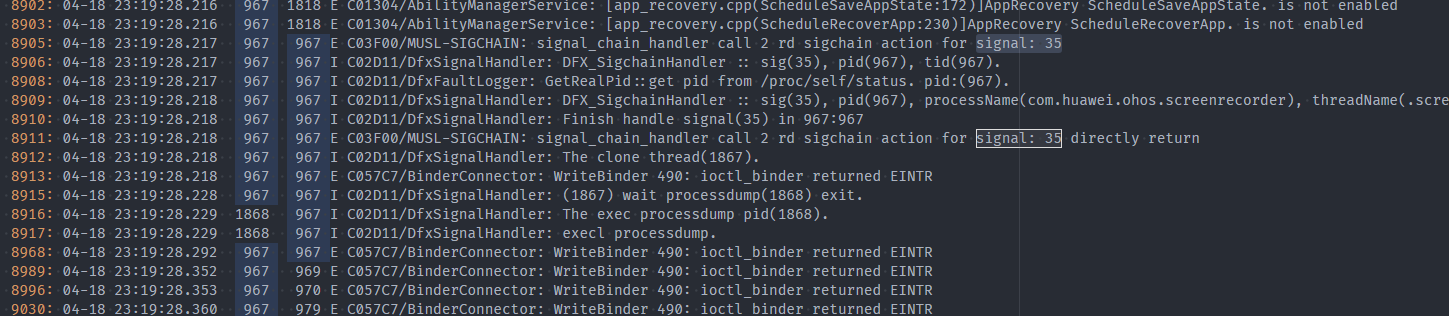
3、后台应用检测(5次后上报),21s左右。
4、记录查杀原因。

5、APPFREEZE kill卡死应用。

一般分析步骤
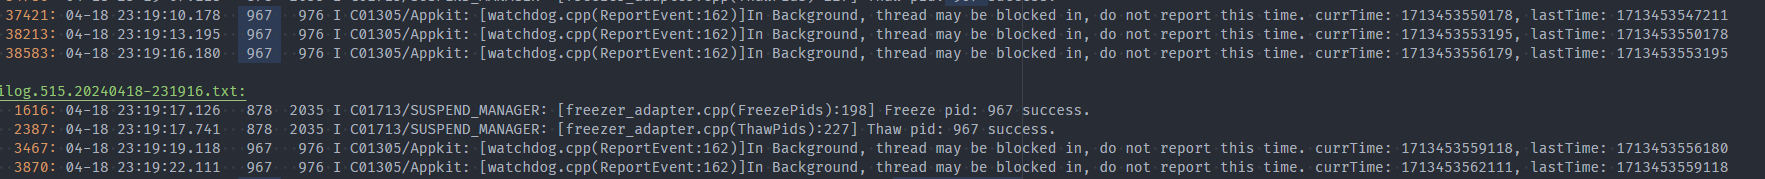
根据故障日志确定上报时间点,再根据具体场景下的故障类型推断卡死开始的时间点,查看对应时间段的hilog日志,分析日志得出应用对应线程运行状态:
- 应用日志完全无打印输出:卡死在最后日志打印的接口调用处。
…
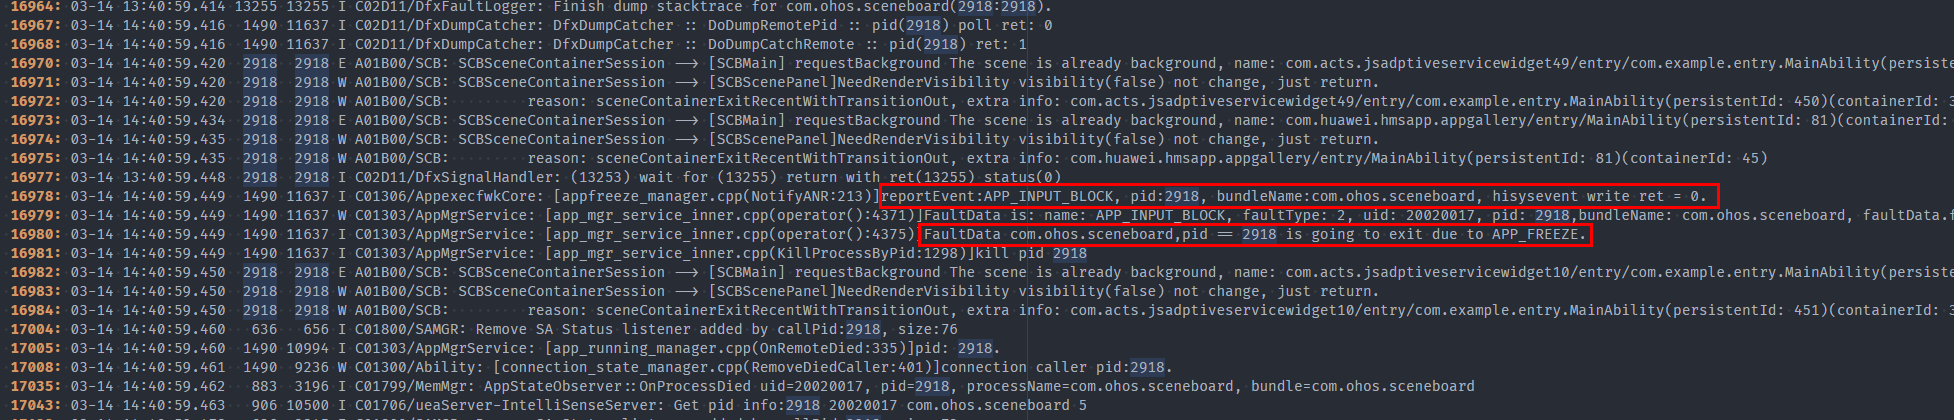
例如上图案例:APP_INPUT_BLOCK类型在07:24:08.167上报,应用主线程在07:24:01.581后无打印,可排查是否为FormManagerService:
[form_mgr_proxy.cpp(GetFormsInfoByApp:1128)] 中的逻辑超时。
- 应用频繁打印输出日志:分析对应输出表示的场景及其合理性。
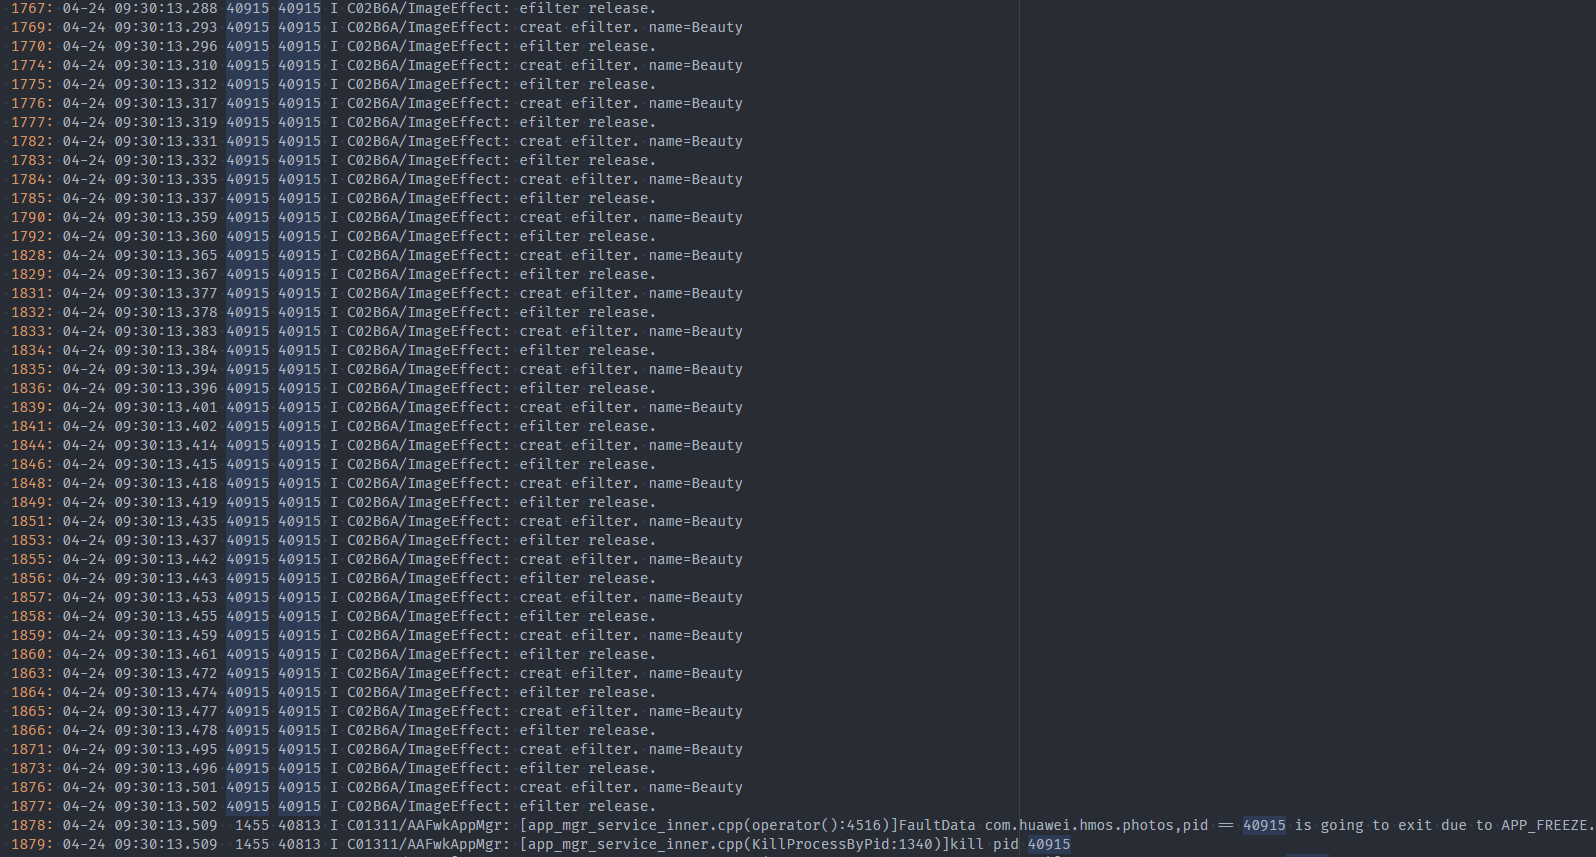
例如上图案例:进程在被APP_FREEZE杀死前在大量输出,对应的ImageEffect领域需排查此日志是否正常。
结合 trace
存在以下可能的情况:
1、进程每一小段业务时间并不长,但是较长时间段运行非常密集,占满了主线程。
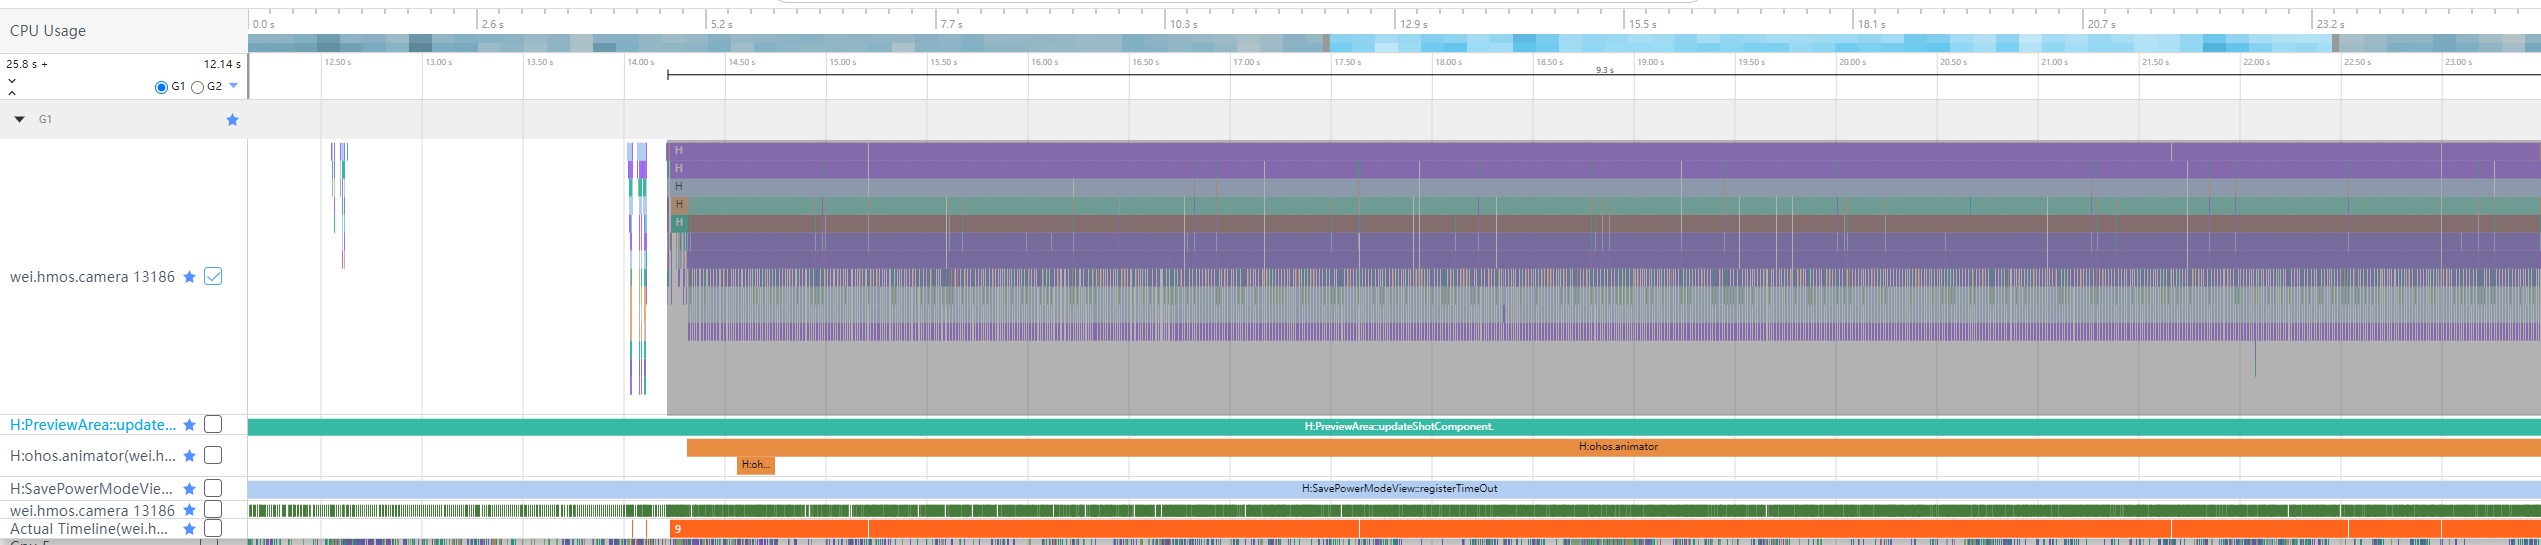

上图案例为:PriviewArea::updateShotComponent(更新组件)->animator(执行动画)->密集的动画执行过程达9.2s;
线程繁忙地循环执行某业务,分析每一小段业务:
不符合业务场景(此处不应该频繁调用),分析业务代码,为何会循环执行;
符合业务场景,分析每一小段业务是否耗时超过预期,性能为何不满足设计规格。
2、进程执行某个函数接口超时。
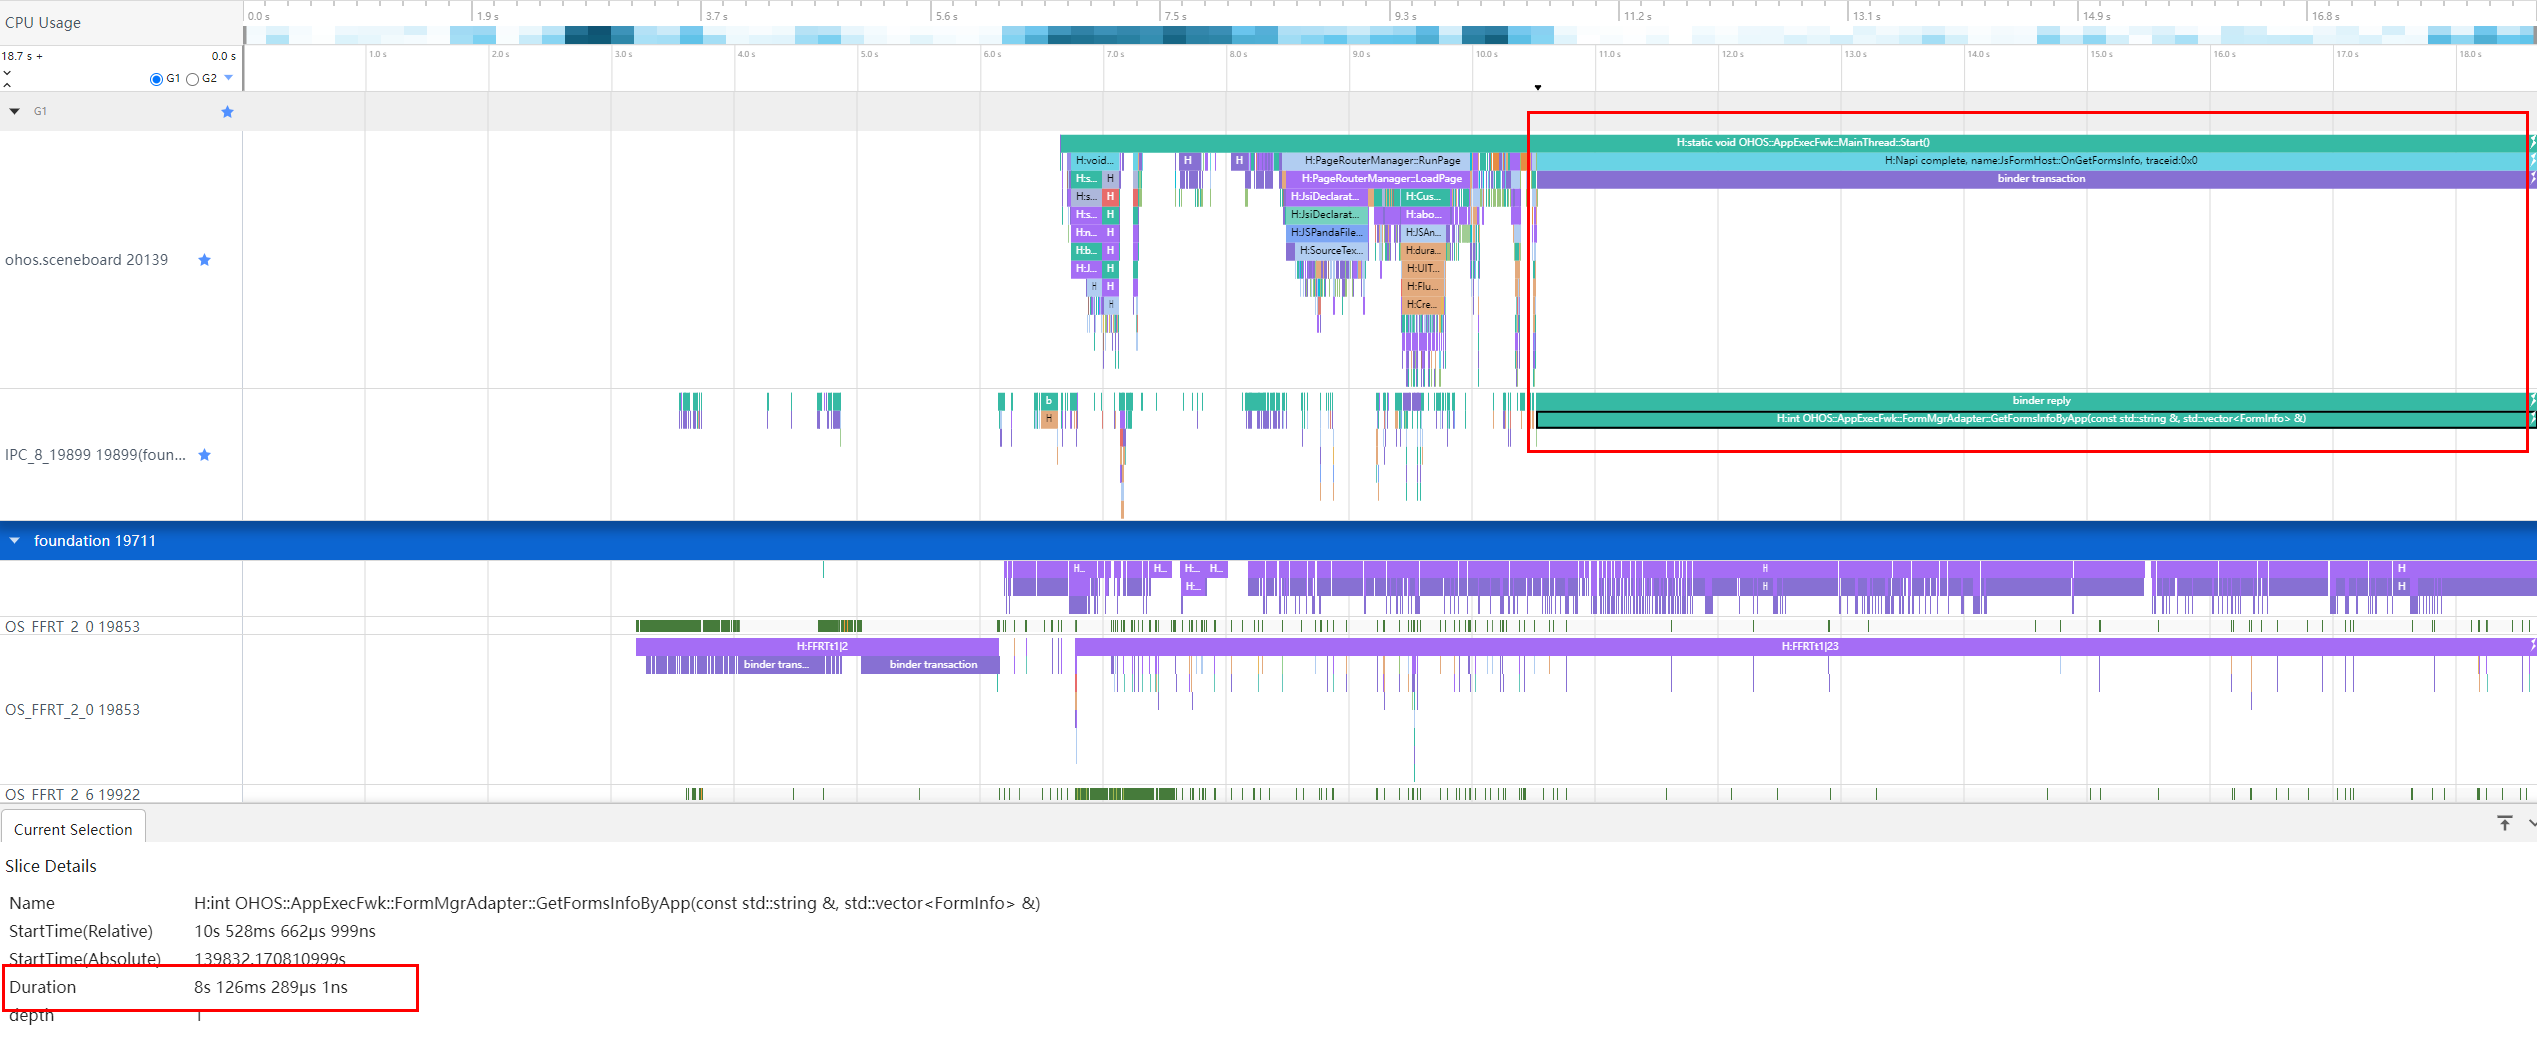
上图案例为:OHOS::AppExecFwk::FormMgrAdapter::GetFormsInfoByApp接口执行时长达到8s。
分析案例
ThreadBlock 类典型案例——未正确使用锁
背景/原理
xxxservice上报THREAD_BLOCK_6S的appfreeze问题。
错误代码案例
代码中通过mutex_.lock()加锁,但是在返回失败情况下未解锁,会导致其他线程一直等锁。
int xxx()
{
    //...
    mutex_.lock();
    AIContext aiContext;
    if (ConvertRpcHandle2AIContext(inputs[0], aiContext) != aicp::SUCCESS) {
        return FAILED;
    }
    //...
}
影响/报错
后台应用卡死时,用户无感知,但相关功能将不可用。
定位思路
提取故障日志关键类别信息。
appfreeze: com.example.hmsapp.xxx THREAD_BLOCK_6S at 20240408082432
DisplayPowerInfo:powerState:AWAKE
从Foreground值可看出,应用此时处于后台。当真正的3s事件上报上来时,后台应用已卡18s前。
Module name:com.xxx.xxx.xxx
Version:1.2.2.202
VersionCode:1002002202
PreInstalled:Yes
Foreground:No  --> 后台
Pid:43675
Uid:20020029
Reason:THREAD_BLOCK_6S
THREAD_BLOCK_3S上报的时间为08:24:29:612;
THREAD_BLOCK_6S上报的时间为08:24:32:638,相隔3s符合预期。
>>>>>>>>>>>>>>>>>>>>>>>>>>>>>>>>>>>>>>>>>>>
DOMAIN:AAFWK
STRINGID:THREAD_BLOCK_6S
TIMESTAMP:2024/04/08-08:24:32:638
PID:43675
UID:20020029
PACKAGE_NAME:com.xxx.xxx.xxx
PROCESS_NAME:com.xxx.xxx.xxx
*******************************************
start time: 2024/04/08-08:24:29:627
DOMAIN = AAFWK
EVENTNAME = THREAD_BLOCK_3S
TIMESTAMP = 2024/04/08-08:24:29:612
PID = 43675
UID = 20020029
PACKAGE_NAME = com.xxx.xxx.xxx
PROCESS_NAME = com.xxx.xxx.xxx
3s上报时会抓取此时的EventHandler信息,时间为08:24:29.413,符合预期上报的原因为:App main thread is not response! 主线程无响应,当前正在运行的任务开始时间为08:24:01.514。
MSG =
Fault time:2024/04/08-08:24:29
App main thread is not response!
mainHandler dump is:
 EventHandler dump begin curTime: 2024-04-08 08:24:29.413
 Event runner (Thread name = , Thread ID = 43675) is running
 Current Running: start at 2024-04-08 08:24:01.514, Event { send thread = 43675, send time = 2024-04-08 08:24:01.514, handle time = 2024-04-08 08:24:01.514, task name = uvLoopTask }
watchdog 任务位于高优先级队列(High priority event queue),如下图可发现:每隔3s就会抛一个任务到主线程去,符合预期。
THREAD_BLOCK_3S、THREAD_BLOCK_6S的队列一致,6s队列较3s队列多了一个event。
最早的一个event send time为08:24:11.388,与3s上报上来的时间08:24:29:612刚好差18s,符合预期。
 High priority event queue information:
 No.1 : Event { send thread = 43679, send time = 2024-04-08 08:24:11.388, handle time = 2024-04-08 08:24:11.388, id = 1, caller = [watchdog.cpp(Timer:139)] }
 No.2 : Event { send thread = 43679, send time = 2024-04-08 08:24:14.458, handle time = 2024-04-08 08:24:14.458, id = 1, caller = [watchdog.cpp(Timer:139)] }
 No.3 : Event { send thread = 43679, send time = 2024-04-08 08:24:17.383, handle time = 2024-04-08 08:24:17.383, id = 1, caller = [watchdog.cpp(Timer:139)] }
 No.4 : Event { send thread = 43679, send time = 2024-04-08 08:24:20.363, handle time = 2024-04-08 08:24:20.363, id = 1, caller = [watchdog.cpp(Timer:139)] }
 No.5 : Event { send thread = 43679, send time = 2024-04-08 08:24:23.418, handle time = 2024-04-08 08:24:23.418, id = 1, caller = [watchdog.cpp(Timer:139)] }
 No.6 : Event { send thread = 43679, send time = 2024-04-08 08:24:26.369, handle time = 2024-04-08 08:24:26.369, id = 1, caller = [watchdog.cpp(Timer:139)] }
 No.7 : Event { send thread = 43679, send time = 2024-04-08 08:24:29.412, handle time = 2024-04-08 08:24:29.412, id = 1, caller = [watchdog.cpp(Timer:139)] }
以上可总结:应用主线程从08:24:01.514开始运行本次任务,第一次3s检测开始时间为08:24:11.388,真正开始卡住的时间在08:24:11左右。
查看主线程栈:从xxx_request_client.so->libsamgr_proxy.z.so->libipc_core.z.so(OHOS::BinderConnector::WriteBinder)
可知:此时,主线程发起了一个ipc请求,对端进程未返回导致卡死,堆栈如下所示:
Tid:43675, Name:xxx
# 00 pc 0000000000168c44 /system/lib/ld-musl-aarch64.so.1(ioctl+176)(91b804d2409a13f27463debe9e19fb5d)
# 01 pc 0000000000049268 /system/lib64/platformsdk/libipc_core.z.so(OHOS::BinderConnector::WriteBinder(unsigned long, void*)+112)(e59500a4ea66775388332f6e3cc12fe3)
# 02 pc 0000000000054fd4 /system/lib64/platformsdk/libipc_core.z.so(OHOS::BinderInvoker::TransactWithDriver(bool)+296)(e59500a4ea66775388332f6e3cc12fe3)
# 03 pc 00000000000544c8 /system/lib64/platformsdk/libipc_core.z.so(OHOS::BinderInvoker::WaitForCompletion(OHOS::MessageParcel*, int*)+304)(e59500a4ea66775388332f6e3cc12fe3)
# 04 pc 0000000000053c84 /system/lib64/platformsdk/libipc_core.z.so(OHOS::BinderInvoker::SendRequest(int, unsigned int, OHOS::MessageParcel&, OHOS::MessageParcel&, OHOS::MessageOption&)+312)(e59500a4ea66775388332f6e3cc12fe3)
# 05 pc 000000000002d6d8 /system/lib64/platformsdk/libipc_core.z.so(OHOS::IPCObjectProxy::SendRequestInner(bool, unsigned int, OHOS::MessageParcel&, OHOS::MessageParcel&, OHOS::MessageOption&)+128)(e59500a4ea66775388332f6e3cc12fe3)
# 06 pc 0000000000030e00 /system/lib64/platformsdk/libipc_core.z.so(OHOS::IPCObjectProxy::GetProtoInfo()+396)(e59500a4ea66775388332f6e3cc12fe3)
# 07 pc 000000000002e990 /system/lib64/platformsdk/libipc_core.z.so(OHOS::IPCObjectProxy::WaitForInit()+292)(e59500a4ea66775388332f6e3cc12fe3)
# 08 pc 0000000000036cd0 /system/lib64/platformsdk/libipc_core.z.so(OHOS::IPCProcessSkeleton::FindOrNewObject(int)+116)(e59500a4ea66775388332f6e3cc12fe3)
# 09 pc 00000000000571cc /system/lib64/platformsdk/libipc_core.z.so(OHOS::BinderInvoker::UnflattenObject(OHOS::Parcel&)+272)(e59500a4ea66775388332f6e3cc12fe3)
# 10 pc 00000000000463a4 /system/lib64/platformsdk/libipc_core.z.so(OHOS::MessageParcel::ReadRemoteObject()+116)(e59500a4ea66775388332f6e3cc12fe3)
# 11 pc 000000000001250c /system/lib64/chipset-pub-sdk/libsamgr_proxy.z.so(OHOS::SystemAbilityManagerProxy::CheckSystemAbility(int, bool&)+952)(6f113f37ac6ac882cfa16077ad5b406a)
# 12 pc 0000000000010e7c /system/lib64/chipset-pub-sdk/libsamgr_proxy.z.so(OHOS::SystemAbilityManagerProxy::GetSystemAbilityWrapper(int, std::__h::basic_string<char, std::__h::char_traits<char>, std::__h::allocator<char>> const&)+232)(6f113f37ac6ac882cfa16077ad5b406a)
# 13 pc 00000000000118b8 /system/lib64/chipset-pub-sdk/libsamgr_proxy.z.so(OHOS::SystemAbilityManagerProxy::Recompute(int, int)+132)(6f113f37ac6ac882cfa16077ad5b406a)
# 14 pc 0000000000011170 /system/lib64/chipset-pub-sdk/libsamgr_proxy.z.so(OHOS::DynamicCache<int, OHOS::sptr<OHOS::IRemoteObject>>::QueryResult(int, int)+316)(6f113f37ac6ac882cfa16077ad5b406a)
# 15 pc 0000000000007e0c xxx_request_client.so(xxx::RPCRequestClient::GetService()+540)(557450139184527807025a632613fd76)
# 16 pc 0000000000008824 xxx_request_client.so(xxx::RPCRequestClient::Init()+16)(557450139184527807025a632613fd76)
# 17 pc 0000000000008d60 xxx_request_client.so(CreateRpcRequestByServiceName+104)(557450139184527807025a632613fd76)
# 18 pc 0000000000008f98 xxx_request_client.so(CreateRpcRequest+72)(557450139184527807025a632613fd76)
# 19 pc 0000000000002944 xxx_rpc_client.so(xxx::xxx::RpcRequestClient::RpcRequestClient()+224)(02343ed2fff69759d408b23eaf69fcde)
查看binderCatcher:此时43675的主线程正在与979进程通信,抓binder时已经卡了27s。
PeerBinderCatcher -- pid==43675 layer_ == 1

BinderCatcher --

    43675:43675 to 979:0 code 5f475249 wait:27.104545829 s frz_state:1,  ns:-1:-1 to -1:-1, debug:35854:35854 to 52462:52462, active_code:0 active_thread:0, pending_async_proc=0  --> binder通信等待了27s
    57187:39147 to 28644:30753 code 0 wait:0.337894271 s frz_state:3,  ns:-1:-1 to -1:-1, debug:57187:39147 to 28644:30753, active_code:0 active_thread:0, pending_async_proc=0
    57187:39151 to 28644:28652 code 7 wait:0.531140625 s frz_state:3,  ns:-1:-1 to -1:-1, debug:57187:39151 to 28644:28652, active_code:0 active_thread:0, pending_async_proc=0
    57187:39150 to 28644:31297 code 0 wait:0.976419270 s frz_state:3,  ns:-1:-1 to -1:-1, debug:57187:39150 to 28644:31297, active_code:0 active_thread:0, pending_async_proc=0
    57187:38979 to 28644:32554 code 0 wait:0.22108334 s frz_state:3,  ns:-1:-1 to -1:-1, debug:57187:38979 to 28644:32554, active_code:0 active_thread:0, pending_async_proc=0
    57187:39149 to 28644:30754 code 0 wait:0.534261979 s frz_state:3,  ns:-1:-1 to -1:-1, debug:57187:39149 to 28644:30754, active_code:0 active_thread:0, pending_async_proc=0
    57187:38949 to 28644:31301 code 0 wait:0.977779166 s frz_state:3,  ns:-1:-1 to -1:-1, debug:57187:38949 to 28644:31301, active_code:0 active_thread:0, pending_async_proc=0
    57187:39172 to 28644:35667 code 0 wait:1.47387500 s frz_state:3,  ns:-1:-1 to -1:-1, debug:57187:39172 to 28644:35667, active_code:0 active_thread:0, pending_async_proc=0
    57187:39173 to 28644:28822 code 0 wait:0.565389063 s frz_state:3,  ns:-1:-1 to -1:-1, debug:57187:39173 to 28644:28822, active_code:0 active_thread:0, pending_async_proc=0
    1477:1676 to 1408:2026 code 17 wait:0.0 s frz_state:3,  ns:-1:-1 to -1:-1, debug:1477:1676 to 1408:2026, active_code:0 active_thread:0, pending_async_proc=0
    628:8136 to 979:0 code 2 wait:13166.722870859 s frz_state:1,  ns:-1:-1 to -1:-1, debug:628:8136 to 979:0, active_code:0 active_thread:0, pending_async_proc=0
查看979进程主线程栈:xxxserver在等待锁释放。该问题即为典型的锁使用不当,导致的等锁卡死。
Binder catcher stacktrace, type is peer, pid : 979
Result: 0 ( no error )
Timestamp:2024-04-08 08:24:29.000
Pid:979
Uid:3094
Process name:xxxserver
Process life time:60410s
Tid:979, Name:xxxserver
# 00 pc 00000000001aafc4 /system/lib/ld-musl-aarch64.so.1(__timedwait_cp+192)(91b804d2409a13f27463debe9e19fb5d)
# 01 pc 00000000001b0d50 /system/lib/ld-musl-aarch64.so.1(__pthread_mutex_timedlock_inner+592)(91b804d2409a13f27463debe9e19fb5d)
# 02 pc 00000000000c38e0 /system/lib64/libc++.so(std::__h::mutex::lock()+8)(0b61ba21a775725a1bd8802a393b133afbc503a5)   --> 调用了lock,然后等待
# 03 pc 00000000000086dc xxx_server.so(xxx::xxx::InitImpl(int, std::__h::vector<xxx::xxx::RpcHandle, std::__h::allocator<xxx::xxx::RpcHandle>> const&, std::__h::vector<xxx::xxx::RpcHandle, std::__h::allocator<xxx::xxx::RpcHandle>>&)+84)(f4bb275898d797b22eae35fe48db9009)
# 04 pc 000000000000798c xxx_request_server.so(xxx::RPCRequestStub::SyncExecute(OHOS::MessageParcel&, OHOS::MessageParcel&)+164)(70cbb10c758902c1e3e179efc93ce0af)
# 05 pc 0000000000008314 xxx_request_server.so(xxx::RPCRequestStub::OnRemoteRequest(unsigned int, OHOS::MessageParcel&, OHOS::MessageParcel&, OHOS::MessageOption&)+300)(70cbb10c758902c1e3e179efc93ce0af)
# 06 pc 00000000000153e4 /system/lib64/chipset-pub-sdk/libipc_single.z.so(OHOS::IPCObjectStub::SendRequest(unsigned int, OHOS::MessageParcel&, OHOS::MessageParcel&, OHOS::MessageOption&)+604)(25b3d63905ef47289c096ea42ba2d86a)
# 07 pc 000000000002b464 /system/lib64/chipset-pub-sdk/libipc_single.z.so(OHOS::IPC_SINGLE::BinderInvoker::OnTransaction(unsigned char const*)+1220)(25b3d63905ef47289c096ea42ba2d86a)
# 08 pc 000000000002baec /system/lib64/chipset-pub-sdk/libipc_single.z.so(OHOS::IPC_SINGLE::BinderInvoker::HandleCommandsInner(unsigned int)+368)(25b3d63905ef47289c096ea42ba2d86a)
# 09 pc 000000000002a6b0 /system/lib64/chipset-pub-sdk/libipc_single.z.so(OHOS::IPC_SINGLE::BinderInvoker::HandleCommands(unsigned int)+60)(25b3d63905ef47289c096ea42ba2d86a)
# 10 pc 000000000002a4dc /system/lib64/chipset-pub-sdk/libipc_single.z.so(OHOS::IPC_SINGLE::BinderInvoker::StartWorkLoop()+120)(25b3d63905ef47289c096ea42ba2d86a)
# 11 pc 000000000002bc2c /system/lib64/chipset-pub-sdk/libipc_single.z.so(OHOS::IPC_SINGLE::BinderInvoker::JoinThread(bool)+92)(25b3d63905ef47289c096ea42ba2d86a)
# 12 pc 0000000000004bd4 xxxserver(02cff7e5dce05d6d28096601458b6f6d)
# 13 pc 00000000000a3b58 /system/lib/ld-musl-aarch64.so.1(libc_start_main_stage2+64)(91b804d2409a13f27463debe9e19fb5d)
反编译后,确定对应卡锁代码行,结合上下文检测锁的使用。
修改方法
int xxx()
{
    //...
    mutex_.lock();
    AIContext aiContext;
    if (ConvertRpcHandle2AIContext(inputs[0], aiContext) != aicp::SUCCESS) {
        return FAILED;
    }
    //...
}
修改为:
int xxx()
{
    //...
    mutex_.lock();
    AIContext aiContext;
    if (ConvertRpcHandle2AIContext(inputs[0], aiContext) != aicp::SUCCESS) {
        mutex_.unlock();
        return FAILED;
    }
    //...
    mutex_.unlock();
    //...
}
结合上下文,合理调整锁的使用。
建议(问题总结)
1、多线程交互时需要格外注意时序、死锁问题。
APP_INPUT_BLOCK 类典型案例——组件全量刷新
背景
用户在切换主题时突然卡死,有sceneboard的appfreeze问题上报。
该问题由线程繁忙引起,导致其卡死。
错误代码实例
组件的刷新复用通过其key值控制。页面更新时,key值不变复用之前的组件,key值变化更新组件及其子组件。
该函数用于生成桌面组件的key,并与themeStyle关联,当用户在桌面连续切换主题时,组件反复全量刷新,导致卡死。
private getForeachKey(item: xxx): string {
    //...
    return `${item.xxx2}${item.xxx2}...${item.themeStyle}`;
}
影响
用户在合一桌面切换主题时,页面高概率卡死,点击无响应,然后闪退到锁屏界面。
严重影响用户体验。
定位思路
提取故障关键信息。
appfreeze: com.example.sceneboard APP_INPUT_BLOCK at 202403144059
DisplayPowerInfo:powerState:AWAKE
APP_INPUT_BLOCK 事件上报时间为 14:40:59:440。
DOMAIN:AAFWK
STRINGID:APP_INPUT_BLOCK
TIMESTAMP:2024/03/14-14:40:59:440 --> 故障上报时间
PID:2918
UID:20020017
PACKAGE_NAME:com.example.sceneboard
PROCESS_NAME:com.example.sceneboard
上报的原因是:User input does not respond! 用户输入事件没有响应。
可以看到,当前任务在主线程(Thread ID == Pid)上运行,任务从14:40:53.499开始运行,直到Fault time14:40:58仍未运行完。
MSG =
Fault time:2024/03/14-14:40:58
User input does not respond!
mainHandler dump is:
 EventHandler dump begin curTime: 2024-03-14 02:40:58.520
 Event runner (Thread name = , Thread ID = 2918) is running
 Current Running: start at 2024-03-14 02:40:53.499, Event { send thread = 2918, send time = 2024-03-14 02:40:53.499, handle time = 2024-03-14 02:40:53.499, task name =  }
用户输入事件需要第一时间响应,所以同watchdog一样都在High priority event queue。
可以看出队列中已经有200+的input event阻塞中未被处理。
 High priority event queue information:
 No.1 : Event { send thread = 3370, send time = 2024-03-14 02:40:53.690, handle time = 2024-03-14 02:40:53.690, task name = , caller = [input_manager_impl.cpp(OnPointerEvent:465)] }
 No.2 : Event { send thread = 3370, send time = 2024-03-14 02:40:53.699, handle time = 2024-03-14 02:40:53.699, task name = , caller = [input_manager_impl.cpp(OnPointerEvent:465)] }
 No.3 : Event { send thread = 3370, send time = 2024-03-14 02:40:53.708, handle time = 2024-03-14 02:40:53.708, task name = , caller = [input_manager_impl.cpp(OnPointerEvent:465)] }
 No.4 : Event { send thread = 3370, send time = 2024-03-14 02:40:53.717, handle time = 2024-03-14 02:40:53.717, task name = , caller = [input_manager_impl.cpp(OnPointerEvent:465)] }
 No.5 : Event { send thread = 3370, send time = 2024-03-14 02:40:53.726, handle time = 2024-03-14 02:40:53.726, task name = , caller = [input_manager_impl.cpp(OnPointerEvent:465)] }
 No.6 : Event { send thread = 3370, send time = 2024-03-14 02:40:53.736, handle time = 2024-03-14 02:40:53.736, task name = , caller = [input_manager_impl.cpp(OnPointerEvent:465)] }
 No.7 : Event { send thread = 3370, send time = 2024-03-14 02:40:53.745, handle time = 2024-03-14 02:40:53.745, task name = , caller = [input_manager_impl.cpp(OnPointerEvent:465)] }
 No.8 : Event { send thread = 3370, send time = 2024-03-14 02:40:53.754, handle time = 2024-03-14 02:40:53.754, task name = , caller = [input_manager_impl.cpp(OnPointerEvent:465)] }
 ...
 No.190 : Event { send thread = 3370, send time = 2024-03-14 02:40:56.166, handle time = 2024-03-14 02:40:56.166, task name = , caller = [input_manager_impl.cpp(OnPointerEvent:465)] }
 No.191 : Event { send thread = 3370, send time = 2024-03-14 02:40:56.176, handle time = 2024-03-14 02:40:56.176, task name = , caller = [input_manager_impl.cpp(OnPointerEvent:465)] }
 No.192 : Event { send thread = 3370, send time = 2024-03-14 02:40:56.186, handle time = 2024-03-14 02:40:56.186, task name = , caller = [input_manager_impl.cpp(OnPointerEvent:465)] }
 No.193 : Event { send thread = 2923, send time = 2024-03-14 02:40:56.196, handle time = 2024-03-14 02:40:56.196, id = 1, caller = [watchdog.cpp(Timer:140)] }
 No.194 : Event { send thread = 3370, send time = 2024-03-14 02:40:56.196, handle time = 2024-03-14 02:40:56.196, task name = , caller = [input_manager_impl.cpp(OnPointerEvent:465)] }
 No.195 : Event { send thread = 3370, send time = 2024-03-14 02:40:56.206, handle time = 2024-03-14 02:40:56.206, task name = , caller = [input_manager_impl.cpp(OnPointerEvent:465)] }
 No.196 : Event { send thread = 3370, send time = 2024-03-14 02:40:56.216, handle time = 2024-03-14 02:40:56.216, task name = , caller = [input_manager_impl.cpp(OnPointerEvent:465)] }
 No.197 : Event { send thread = 3370, send time = 2024-03-14 02:40:56.226, handle time = 2024-03-14 02:40:56.226, task name = , caller = [input_manager_impl.cpp(OnPointerEvent:465)] }
 No.198 : Event { send thread = 3370, send time = 2024-03-14 02:40:56.236, handle time = 2024-03-14 02:40:56.236, task name = , caller = [input_manager_impl.cpp(OnPointerEvent:465)] }
 No.199 : Event { send thread = 3370, send time = 2024-03-14 02:40:56.245, handle time = 2024-03-14 02:40:56.245, task name = , caller = [input_manager_impl.cpp(OnPointerEvent:465)] }
 No.200 : Event { send thread = 3370, send time = 2024-03-14 02:40:56.254, handle time = 2024-03-14 02:40:56.254, task name = , caller = [input_manager_impl.cpp(OnPointerEvent:465)] }
 No.201 : Event { send thread = 3370, send time = 2024-03-14 02:40:56.265, handle time = 2024-03-14 02:40:56.265, task name = , caller = [input_manager_impl.cpp(OnPointerEvent:465)] }
 No.202 : Event { send thread = 3370, send time = 2024-03-14 02:40:56.275, handle time = 2024-03-14 02:40:56.274, task name = , caller = [input_manager_impl.cpp(OnPointerEvent:465)] }
 No.203 : Event { send thread = 3370, send time = 2024-03-14 02:40:56.284, handle time = 2024-03-14 02:40:56.284, task name = , caller = [input_manager_impl.cpp(OnPointerEvent:465)] }
 No.204 : Event { send thread = 3370, send time = 2024-03-14 02:40:56.294, handle time = 2024-03-14 02:40:56.294, task name = , caller = [input_manager_impl.cpp(OnPointerEvent:465)] }
 No.205 : Event { send thread = 3370, send time = 2024-03-14 02:40:56.305, handle time = 2024-03-14 02:40:56.305, task name = , caller = [input_manager_impl.cpp(OnPointerEvent:465)] }
从逻辑上看,input event触发应用主线程任务开始执行,但是6s还没有执行完,导致ANR超时; 因此,只需要关注input触发应用执行的具体任务,及对应任务执行超时的原因。
主线程栈:此时运行时状态,栈顶的ark_jsruntime.so中的GetCurrentThreadId并非持锁阻塞或耗时很长的函数,抓到的栈为瞬时栈,没有参考意义。
Tid:2918, Name:example.sceneboard
# 00 pc 000000000009f73c /system/lib/ld-musl-aarch64.so.1(8fa55898166cd804dad43d909b5319cc)
# 01 pc 000000000054b7b4 /system/lib64/platformsdk/libark_jsruntime.so(panda::os::thread::GetCurrentThreadId()+12)(7715646e48f750f3dc31e660b056eb43)
# 02 pc 00000000002107a4 /system/lib64/platformsdk/libark_jsruntime.so(panda::ecmascript::EcmaVM::CheckThread() const+200)(7715646e48f750f3dc31e660b056eb43)
# 03 pc 0000000000432998 /system/lib64/platformsdk/libark_jsruntime.so(panda::JSNApi::GetHandleAddr(panda::ecmascript::EcmaVM const*, unsigned long)+64)(7715646e48f750f3dc31e660b056eb43)
# 04 pc 000000000003eeb8 /system/lib64/platformsdk/libace_napi.z.so(ArkNativeReference::Get()+32)(c3a760aff0c73a2e76accaf518321fc9)
# 05 pc 0000000000043cb4 /system/lib64/platformsdk/libace_napi.z.so(napi_get_reference_value+48)(c3a760aff0c73a2e76accaf518321fc9)
# 06 pc 0000000000007564 /system/lib64/module/events/libemitter.z.so(OHOS::AppExecFwk::SearchCallbackInfo(napi_env__*, std::__h::variant<unsigned int, std::__h::basic_string<char, std::__h::char_traits<char>, std::__h::allocator<char>>> const&, napi_value__*)+248)(8fe2937855aab3ea839419f952597511)
# 07 pc 0000000000007d8c /system/lib64/module/events/libemitter.z.so(OHOS::AppExecFwk::OnOrOnce(napi_env__*, napi_callback_info__*, bool)+568)(8fe2937855aab3ea839419f952597511)
# 08 pc 00000000000096d8 /system/lib64/module/events/libemitter.z.so(OHOS::AppExecFwk::JS_Once(napi_env__*, napi_callback_info__*) (.cfi)+84)(8fe2937855aab3ea839419f952597511)
# 09 pc 000000000002c8f0 /system/lib64/platformsdk/libace_napi.z.so(ArkNativeFunctionCallBack(panda::JsiRuntimeCallInfo*)+168)(c3a760aff0c73a2e76accaf518321fc9)
# 10 pc 0000000000187b48 /system/lib64/module/arkcompiler/stub.an(RTStub_PushCallArgsAndDispatchNative+40)
# 11 pc 00000000002da5fc /system/lib64/platformsdk/libark_jsruntime.so(panda::ecmascript::InterpreterAssembly::Execute(panda::ecmascript::EcmaRuntimeCallInfo*)+416)(7715646e48f750f3dc31e660b056eb43)
# 12 pc 00000000002da5fc /system/lib64/platformsdk/libark_jsruntime.so(panda::ecmascript::InterpreterAssembly::Execute(panda::ecmascript::EcmaRuntimeCallInfo*)+416)(7715646e48f750f3dc31e660b056eb43)
# 13 pc 00000000003954a0 /system/lib64/platformsdk/libark_jsruntime.so(panda::ecmascript::JSStableArray::HandleforEachOfStable(panda::ecmascript::JSThread*, panda::ecmascript::JSHandle<panda::ecmascript::JSObject>, panda::ecmascript::JSHandle<panda::ecmascript::JSTaggedValue>, panda::ecmascript::JSHandle<panda::ecmascript::JSTaggedValue>, unsigned int, unsigned int&)+596)(7715646e48f750f3dc31e660b056eb43)
# 14 pc 000000000018f4b0 /system/lib64/platformsdk/libark_jsruntime.so(panda::ecmascript::builtins::BuiltinsArray::ForEach(panda::ecmascript::EcmaRuntimeCallInfo*)+840)(7715646e48f750f3dc31e660b056eb43)
...
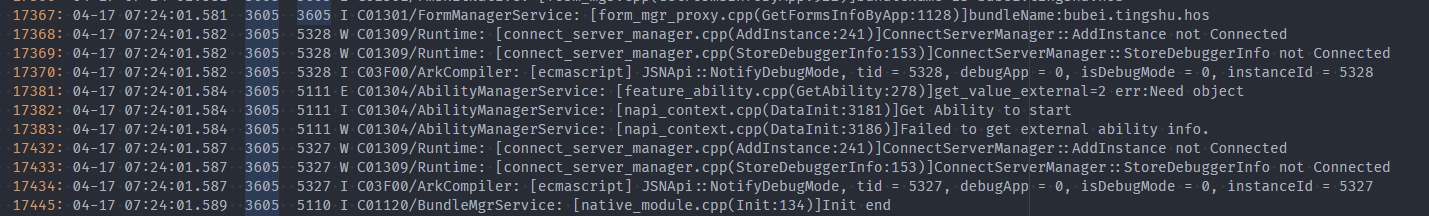
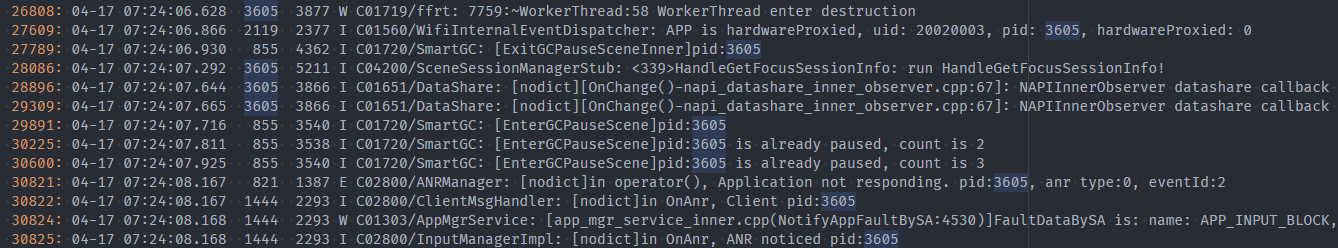
接下来排查流水日志:
首先找到上报APP_INPUT_BLOCK的时间点,大约在13:40:59.448。事件上报完后,dfx将卡死的scb杀掉。
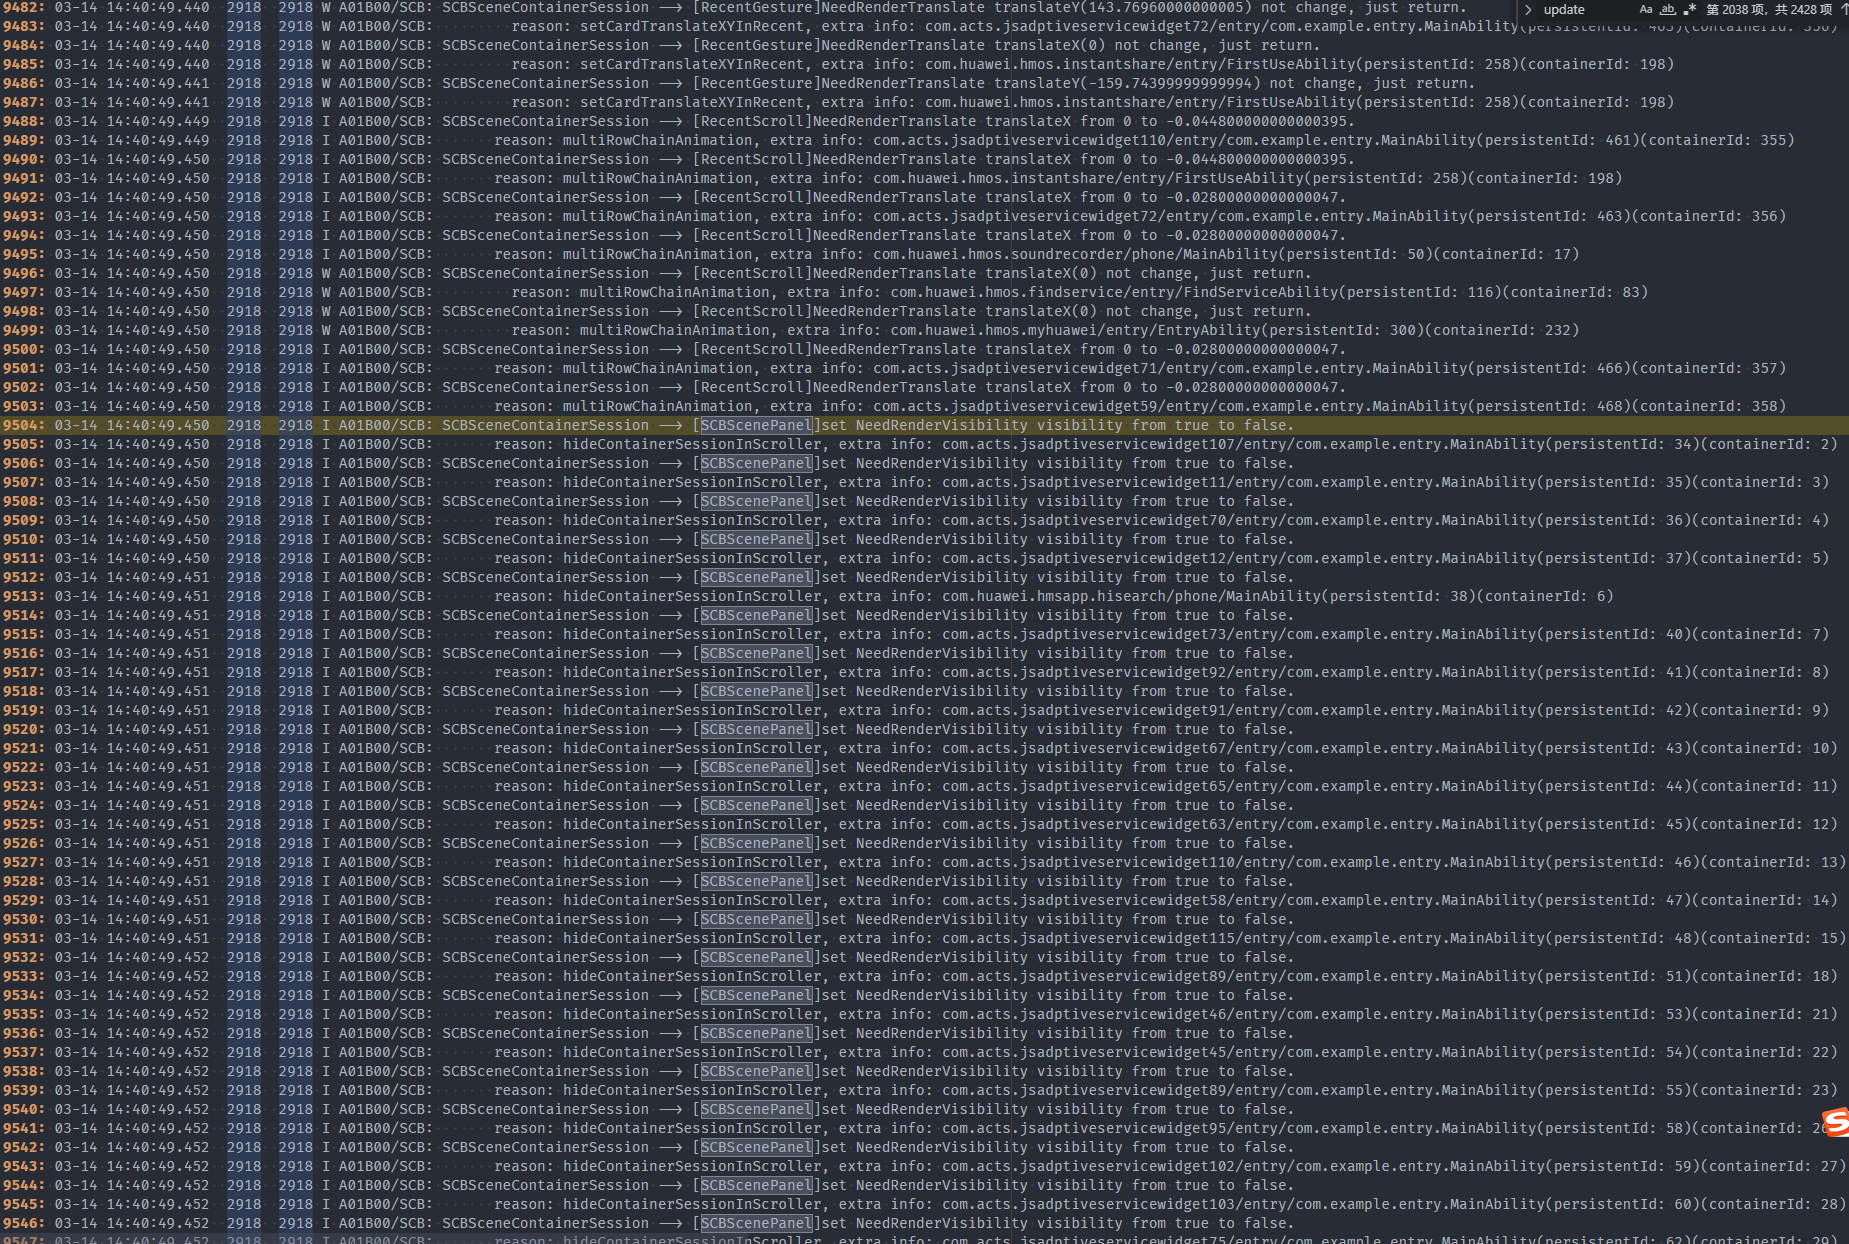
往前推6s左右,可以看到在14:40:53.498左右,有一个点击事件发给了scb。
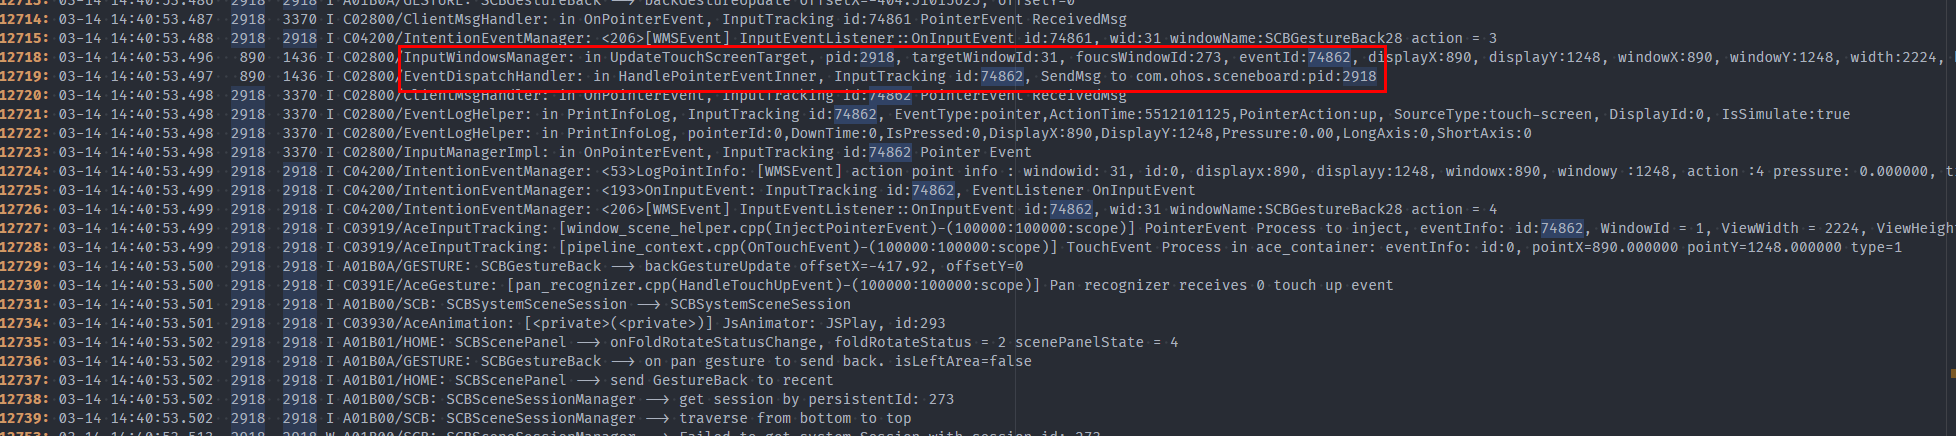
这之间的6s存在大量的scb日志,判断是在进行更新渲染。
查看对应时间点的trace:
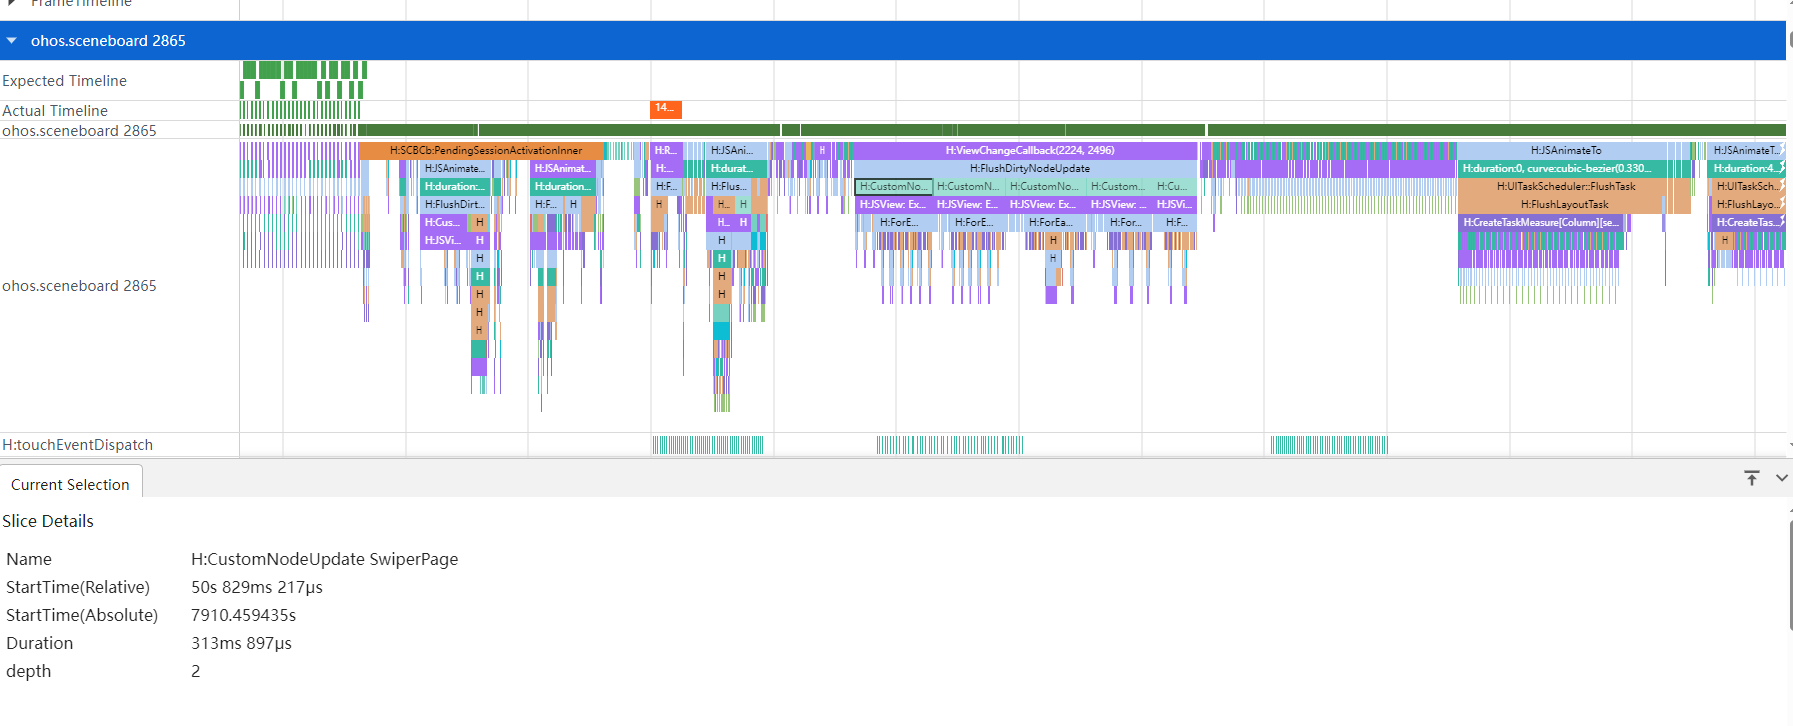
发现scb主线程被占满,非常繁忙。耗时较长的任务是CustomNodeUpdate SwiperPage,后续需排查该组件里为何一直在刷新。
对应领域排查后发现:swiperPage上将themeStyle加入到了key里面,key变化就会触发控件新建流程。
当切换主题或者切换图标风格时,桌面上控件会全量新建,使得主线程繁忙,导致输入事件未响应。
修改方法
仅在切换桌面组件风格时,才触发桌面组件的刷新,缩小刷新范围。
+ if (!CheckEmptyUtils.isEmpty(themeStyleInfo.iconResourcePath) &&
+     themeStyleInfo.iconResourcePath !== this.themeStyle.iconResourcePath) {
+     this.isStyleChanged = true;
+     this.themeStyle.iconResourcePath = themeStyleInfo.iconResourcePath; --> themeStyle 与 iconResourcePath 关联
+ }
推荐建议(问题总结)
1、用户点击触发页面更新时,需要合理控制页面刷新的范围,考虑大量组件、频繁刷新等场景。
LIFECYCLE_TIMEOUT 类典型案例——加载云图
背景/原理
用户在打开云笔记时应用卡死后闪退。
错误代码实例
在循环中同步获取云图。
public static xxxFunction(fileUris: string[]): void {
    //...
    for (const fileuril of fileUrils) {
        let file = fs.openSync(fileUri, fs.OpenMode.READ_ONLY);
        //...
    }
    //...
}
影响/报错
应用拉起、切前台等过程中卡死并闪退。
定位思路
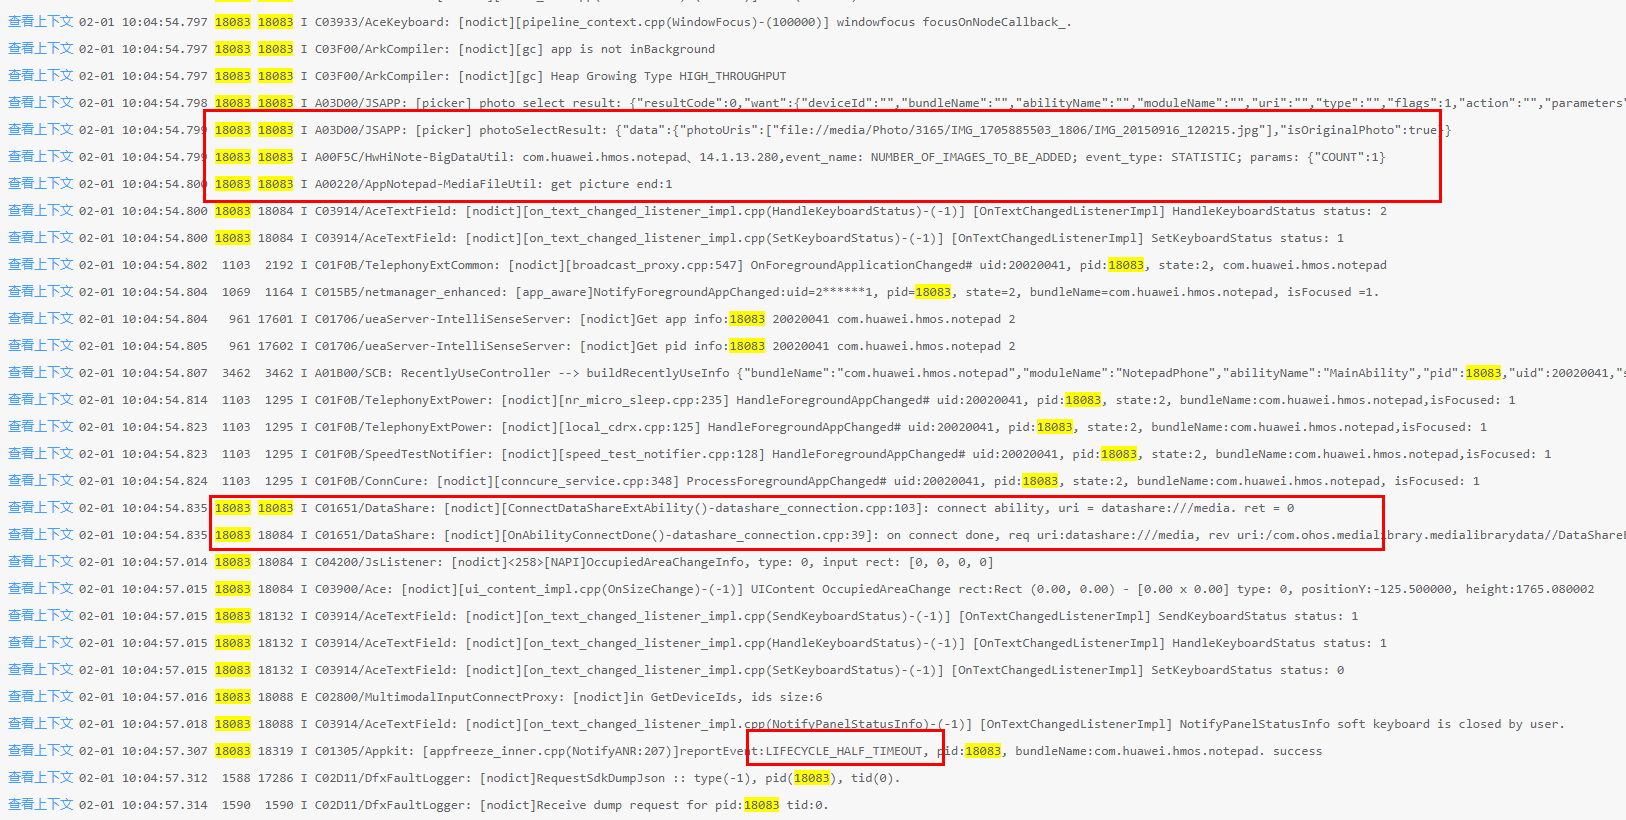
以notepad LIFECYCLE_TIMEOUT为例,提取故障关键信息:
sysfreeze: LIFECYCLE_TIMEOUT LIFECYCLE_TIMEOUT at 20240201100459
查看MSG信息:foreground timeout,对应时长为 5s。
MSG =
Fault time:2024/02/01-10:04:57
ability:MainAbility foreground timeout.
server:
312522; AbilityRecord::ForegroundAbility; the ForegroundAbility lifecycle starts.
client:
312522; AbilityThread::ScheduleAbilityTransaction; the foreground lifecycle.
LIFECYCLE_HALF_TIMEOUT 上报时间为10:04:57:538;
LIFECYCLE_TIMEOUT 上报时间为10:04:59:965;相隔约2.5s,符合预期。
>>>>>>>>>>>>>>>>>>>>>>>>>>>>>>>>>>>>>>>>>>>
DOMAIN:AAFWK
STRINGID:LIFECYCLE_TIMEOUT
TIMESTAMP:2024/02/01-10:04:59:965
PID:18083
UID:20020041
PACKAGE_NAME:com.example.notepad
PROCESS_NAME:com.example.notepad
*******************************************
start time: 2024/02/01-10:04:57:555
DOMAIN = AAFWK
EVENTNAME = LIFECYCLE_HALF_TIMEOUT
TIMESTAMP = 2024/02/01-10:04:57:538
PID = 18083
UID = 20020041
TID = 17286
PACKAGE_NAME = com.example.notepad
PROCESS_NAME = com.example.notepad
任务开始的时间为10:04:54.798,离LIFECYCLE_HALF_TIMEOUT相隔约2.5s,符合预期。
mainHandler dump is:
 EventHandler dump begin curTime: 2024-02-01 10:04:57.306
 Event runner (Thread name = , Thread ID = 18083) is running
 Current Running: start at 2024-02-01 10:04:54.798, Event { send thread = 18132, send time = 2024-02-01 10:04:54.778, handle time = 2024-02-01 10:04:54.778, task name = UIAbilityThread:SendResult }
 History event queue information:
 No. 0 : Event { send thread = 18083, send time = 2024-02-01 10:04:46.481, handle time = 2024-02-01 10:04:46.981, trigger time = 2024-02-01 10:04:46.982, completeTime time = 2024-02-01 10:04:46.982, task name =  }
 No. 1 : Event { send thread = 18132, send time = 2024-02-01 10:04:47.149, handle time = 2024-02-01 10:04:47.149, trigger time = 2024-02-01 10:04:47.149, completeTime time = 2024-02-01 10:04:47.197, task name = MainThread:BackgroundApplication }
 No. 2 : Event { send thread = 18083, send time = 2024-02-01 10:04:44.329, handle time = 2024-02-01 10:04:47.329, trigger time = 2024-02-01 10:04:47.329, completeTime time = 2024-02-01 10:04:47.329, task name =  }
 No. 3 : Event { send thread = 18087, send time = 2024-02-01 10:04:48.091, handle time = 2024-02-01 10:04:48.091, trigger time = 2024-02-01 10:04:48.091, completeTime time = 2024-02-01 10:04:48.091, task name =  }
 No. 4 : Event { send thread = 18087, send time = 2024-02-01 10:04:51.047, handle time = 2024-02-01 10:04:51.047, trigger time = 2024-02-01 10:04:51.048, completeTime time = 2024-02-01 10:04:51.048, task name =  }
 No. 5 : Event { send thread = 18087, send time = 2024-02-01 10:04:54.067, handle time = 2024-02-01 10:04:54.067, trigger time = 2024-02-01 10:04:54.067, completeTime time = 2024-02-01 10:04:54.067, task name =  }
 ...
查看对应的堆栈信息:libfs.z.so->libdatashare_consumer.z.so->libipc_core.z.so。
Tid:18083, Name:ei.example.notepad
# 00 pc 00000000001617a4 /system/lib/ld-musl-aarch64.so.1(ioctl+180)(4ca73cff61bea7c4a687eb0f71c9df69)
# 01 pc 000000000003e8a0 /system/lib64/platformsdk/libipc_core.z.so(OHOS::BinderConnector::WriteBinder(unsigned long, void*)+72)(3248fceb1fa676994734e0437430ce37)
# 02 pc 0000000000049f38 /system/lib64/platformsdk/libipc_core.z.so(OHOS::BinderInvoker::TransactWithDriver(bool)+296)(3248fceb1fa676994734e0437430ce37)
# 03 pc 00000000000496f8 /system/lib64/platformsdk/libipc_core.z.so(OHOS::BinderInvoker::WaitForCompletion(OHOS::MessageParcel*, int*)+116)(3248fceb1fa676994734e0437430ce37)
# 04 pc 00000000000490bc /system/lib64/platformsdk/libipc_core.z.so(OHOS::BinderInvoker::SendRequest(int, unsigned int, OHOS::MessageParcel&, OHOS::MessageParcel&, OHOS::MessageOption&)+312)(3248fceb1fa676994734e0437430ce37)
# 05 pc 0000000000027700 /system/lib64/platformsdk/libipc_core.z.so(OHOS::IPCObjectProxy::SendRequestInner(bool, unsigned int, OHOS::MessageParcel&, OHOS::MessageParcel&, OHOS::MessageOption&)+132)(3248fceb1fa676994734e0437430ce37)
# 06 pc 000000000002799c /system/lib64/platformsdk/libipc_core.z.so(OHOS::IPCObjectProxy::SendRequest(unsigned int, OHOS::MessageParcel&, OHOS::MessageParcel&, OHOS::MessageOption&)+140)(3248fceb1fa676994734e0437430ce37)
# 07 pc 000000000002640c /system/lib64/platformsdk/libdatashare_consumer.z.so(OHOS::DataShare::DataShareProxy::OpenFile(OHOS::Uri const&, std::__h::basic_string<char, std::__h::char_traits<char>, std::__h::allocator<char>> const&)+440)(e93b5085235269d4b7218ea7de64b69a)
# 08 pc 0000000000014b2c /system/lib64/platformsdk/libdatashare_consumer.z.so(OHOS::DataShare::ExtSpecialController::OpenFile(OHOS::Uri const&, std::__h::basic_string<char, std::__h::char_traits<char>, std::__h::allocator<char>> const&)+160)(e93b5085235269d4b7218ea7de64b69a)
# 09 pc 0000000000022c54 /system/lib64/platformsdk/libdatashare_consumer.z.so(OHOS::DataShare::DataShareHelperImpl::OpenFile(OHOS::Uri&, std::__h::basic_string<char, std::__h::char_traits<char>, std::__h::allocator<char>> const&)+96)(e93b5085235269d4b7218ea7de64b69a)
# 10 pc 0000000000108b34 /system/lib64/module/file/libfs.z.so(OHOS::FileManagement::ModuleFileIO::OpenFileByDatashare(std::__h::basic_string<char, std::__h::char_traits<char>, std::__h::allocator<char>> const&, unsigned int)+468)(152580bf9c379f11f29fdded278541bd)
# 11 pc 0000000000108264 /system/lib64/module/file/libfs.z.so(OHOS::FileManagement::ModuleFileIO::OpenFileByUri(std::__h::basic_string<char, std::__h::char_traits<char>, std::__h::allocator<char>> const&, unsigned int)+1760)(152580bf9c379f11f29fdded278541bd)
# 12 pc 00000000001077fc /system/lib64/module/file/libfs.z.so(OHOS::FileManagement::ModuleFileIO::Open::Sync(napi_env__*, napi_callback_info__*) (.cfi)+1036)(152580bf9c379f11f29fdded278541bd)
# 13 pc 000000000002bbf8 /system/lib64/platformsdk/libace_napi.z.so(ArkNativeFunctionCallBack(panda::JsiRuntimeCallInfo*)+168)(f5b81db475835ee752235c606b1c5e33)
# 14 pc 0000000000132e48 /system/lib64/module/arkcompiler/stub.an
通过binder可以看出与5235进程通信时长大于2.5s,符合预期。
PeerBinderCatcher -- pid==18083 layer_ == 1

BinderCatcher --

    18083:18083 to 5235:7437 code 2 wait:2.723147396 s,  ns:-1:-1 to -1:-1, debug:18083:18083 to 5235:7437, active_code:0 active_thread:0, pending_async_proc=0
    3462:3840 to 4956:4958 code 8 wait:261.213830169 s,  ns:-1:-1 to -1:-1, debug:3462:3840 to 4956:4958, active_code:0 active_thread:0, pending_async_proc=0
    3462:3621 to 4956:4981 code 8 wait:273.550283291 s,  ns:-1:-1 to -1:-1, debug:3462:3621 to 4956:4981, active_code:0 active_thread:0, pending_async_proc=0
5235是媒体库进程,该堆栈无有效信息。
Binder catcher stacktrace, type is peer, pid : 5235
Result: 0 ( no error )
Timestamp:2024-02-01 10:04:57.000
Pid:5235
Uid:20020079
Process name:com.medialibrary.medialibrarydata
Tid:5235, Name:edialibrarydata
# 00 pc 0000000000142d1c /system/lib/ld-musl-aarch64.so.1(epoll_wait+84)(4ca73cff61bea7c4a687eb0f71c9df69)
# 01 pc 000000000000fb74 /system/lib64/chipset-pub-sdk/libeventhandler.z.so(OHOS::AppExecFwk::EpollIoWaiter::WaitFor(std::__h::unique_lock<std::__h::mutex>&, long)+224)(a4d21072c08fd3ac639d5cf5b8fb8b51)
# 02 pc 0000000000019df8 /system/lib64/chipset-pub-sdk/libeventhandler.z.so(OHOS::AppExecFwk::EventQueue::WaitUntilLocked(std::__h::chrono::time_point<std::__h::chrono::steady_clock, std::__h::chrono::duration<long long, std::__h::ratio<1l, 1000000000l>>> const&, std::__h::unique_lock<std::__h::mutex>&)+180)(a4d21072c08fd3ac639d5cf5b8fb8b51)
# 03 pc 0000000000019c6c /system/lib64/chipset-pub-sdk/libeventhandler.z.so(OHOS::AppExecFwk::EventQueue::GetEvent()+128)(a4d21072c08fd3ac639d5cf5b8fb8b51)
# 04 pc 00000000000202b8 /system/lib64/chipset-pub-sdk/libeventhandler.z.so(OHOS::AppExecFwk::(anonymous namespace)::EventRunnerImpl::Run()+1164)(a4d21072c08fd3ac639d5cf5b8fb8b51)
# 05 pc 0000000000022388 /system/lib64/chipset-pub-sdk/libeventhandler.z.so(OHOS::AppExecFwk::EventRunner::Run()+120)(a4d21072c08fd3ac639d5cf5b8fb8b51)
# 06 pc 000000000007ea08 /system/lib64/platformsdk/libappkit_native.z.so(OHOS::AppExecFwk::MainThread::Start()+772)(183fe2babcfdd3e1ea4bca16a0e26a5d)
# 07 pc 0000000000011ac8 /system/bin/appspawn(RunChildProcessor+236)(7b715884c45cfe57b22df46fdaeeca88)
# 08 pc 0000000000034684 /system/bin/appspawn(AppSpawnChild+264)(7b715884c45cfe57b22df46fdaeeca88)
# 09 pc 00000000000344f4 /system/bin/appspawn(AppSpawnProcessMsg+380)(7b715884c45cfe57b22df46fdaeeca88)
# 10 pc 00000000000305a0 /system/bin/appspawn(OnReceiveRequest+1820)(7b715884c45cfe57b22df46fdaeeca88)
# 11 pc 0000000000017c58 /system/lib64/chipset-pub-sdk/libbegetutil.z.so(HandleRecvMsg_+260)(22f33d1b0218f31bad0dcc75cf348b90)
# 12 pc 00000000000178fc /system/lib64/chipset-pub-sdk/libbegetutil.z.so(HandleStreamEvent_+148)(22f33d1b0218f31bad0dcc75cf348b90)
# 13 pc 0000000000015478 /system/lib64/chipset-pub-sdk/libbegetutil.z.so(ProcessEvent+112)(22f33d1b0218f31bad0dcc75cf348b90)
# 14 pc 0000000000015090 /system/lib64/chipset-pub-sdk/libbegetutil.z.so(RunLoop_+308)(22f33d1b0218f31bad0dcc75cf348b90)
# 15 pc 000000000002eff4 /system/bin/appspawn(AppSpawnRun+116)(7b715884c45cfe57b22df46fdaeeca88)
# 16 pc 000000000001f438 /system/bin/appspawn(main+724)(7b715884c45cfe57b22df46fdaeeca88)
# 17 pc 00000000000a0974 /system/lib/ld-musl-aarch64.so.1(libc_start_main_stage2+64)(4ca73cff61bea7c4a687eb0f71c9df69)
# 18 pc 000000000001106c /system/bin/appspawn(_start_c+76)(7b715884c45cfe57b22df46fdaeeca88)
以上可以得到信息:应用通过文件系统Open::Sync同步通过uri加载文件,调用datashare请求媒体库文件数据。
查看对应时间点的流水信息:进程调用datashare加载云图后卡死,与堆栈信息吻合。
查看具体代码:
在循环中同步加载fileUri是不合理的,当弱网环境或者同时加载大量数据时,极易出现卡死情况,应用侧需进行整改。
修改方法
同步加载改为异步加载,并使用标志位标识是否加载完毕,用户界面展示加载中效果。
public static xxxFunction(fileUris: string[]): void {
    //...
    for (const fileuril of fileUrils) {
        let file = fs.openSync(fileUri, fs.OpenMode.READ_ONLY);
        //...
    }
    //...
}
修改为:
public static async xxxFunction(fileUris: string[]): void {
    //...
    AppStorage.setOrCreate<boolean>('isLoadingPic', true); --> 用于页面 load 效果展示
    for (const fileuril of fileUrils) {
        let file = await fs.open(fileUri, fs.OpenMode.READ_ONLY);
        //...
    }
    //...
}
推荐建议(问题总结)
1、请求云侧数据需要验证充分,包括有网、弱网和无网场景下;
2、不要在应用生命周期函数中做耗时操作。
你可能感兴趣的鸿蒙文章
- 所属分类: 后端技术
- 本文标签:
热门推荐
-
2、 优质文章
-
3、 gt
-
7、 openharmony
-
9、 golang
-
10、 Vue中input框自动聚焦