harmony 鸿蒙Analyzing JS Crash
Analyzing JS Crash
When an application crashes dues to a JS exception, it generates a JS crash log file. You can view the log to locate the error code and analyze the cause of the crash.
This topic describes the JS Crash capture, JS Crash analysis, and typical cases.
JS Crash Detection
JS Crash Log Specifications
The following describes the fields in a process crash log.
Device info:XXX <- Device information
Build info:XXX-XXXX X.X.X.XX(XXXXXXXX) <- Build information
Fingerprint:ed1811f3f5ae13c7262b51aab73ddd01df95b2c64466a204e0d70e6461cf1697 <- Feature information
Timestamp:XXXX-XX-XX XX:XX:XX.XXX <- Timestamp
Module name:com.example.myapplication <- Module name
Version:1.0.0 <- Version number
VersionCode:1000000 <- Version code
Pid:579 <- Process ID
Uid:0 <- User ID
Process Memory(kB): 1897(Rss) <- Memory used by the process
Device Memory(kB): Total 1935820, Free 482136, Available 1204216  <- Memory information of the device
Reason:TypeError <- Cause
Error message:Cannot read property c of undefined <- Error message
Cannot get SourceMap info, dump raw stack: <- The release package does not contain the **SourceMap** file, and the JS stack fails to parse it.
SourceCode:
        var a = b.c;   <- Location of the exception code
                ^
Stacktrace:
    at onPageShow entry (entry/src/main/ets/pages/Index.ets:7:13)  <- Call stack of the exception code
           ^        ^                              ^
         Function name Module package name The row and column numbers in the file
You can identify the cause of the JS crash, mostly application issues, based on Error message and Stacktrace in the logs.
Formats of Exception Code Call Stacks
In the debug and release modes, the formats of the exception code call stacks are different. Specifically, the debugging information is retained in the debug mode, and the debugging information is stripped in the release mode through code optimization and obfuscation.
Release Mode
In an application built in release mode, the standard format of exception stack information is as follows:
at
The following is an example:
at onPageShow (entry|har1|1.0.0|src/main/ets/pages/Index.ts:7:13);
Format description:
Fixed identifier: at is the fixed start identifier of the stack call chain.
Execution method name: onPageShow indicates the name of the calling method that triggers an exception.
Source code path structure:
- Source code path: For details, see the key field in Exception Stack Trace Analysis: Sourcemap Format.
- File type: The file name extension is .ts.
Row and column numbers: Colons (:) are used to separate row and column numbers.
Debug Mode
In an application built in debug mode or a release application whose exception stack is translated using source map, the standard format of exception stack information is as follows:
at
The following is an example:
at onPageShow har1 (har1/src/main/ets/pages/Index.ets:7:13);
Format description:
Fixed identifier: at is the fixed start identifier of the stack call chain.
Execution method name: onPageShow indicates the name of the calling method that triggers an exception.
Source code path structure:
- Module name: Name of the module to which the source code path belongs (for example, har1 in the example).
- Source code path: Source code file path based on the project directory.
- File type: The file name extension is .ets.
Row and column numbers: Colons (:) are used to separate row and column numbers.
JS Crash Exception Types
JS crashes are classified into the following types in the Reason field based on exception scenarios:
Error: Error is the most basic type. Other error types are inherited from this type. The Error object consists of message and name, which indicate the error message and error name, respectively. Generally, exceptions of the Error type are thrown by developers.
TypeError: As the most common error type at run-time, TypeError indicates a variable or parameter that is not of the expected type.
SyntaxError: SyntaxError is also called parsing error. As the most common error type in all programming languages, SyntaxError indicates that the syntax does not comply with the syntax specifications of the programming language.
RangeError: RangeError is thrown when a value exceeds the valid range. Common range errors include the following:
- The array length is negative or too long.
- The numeric parameter exceeds the predefined range.
- The number of function stack calls exceeds the maximum.
ReferenceError: ReferenceError is thrown when a variable that does not exist is referenced. Each time a variable is created, the variable name and its value are stored in the key-value format. When a variable is referenced, the value will be located based on the key and returned. If the variable referenced cannot be to be found, ReferenceError is thrown.
URI Error: URI Error is thrown when an invalid URI is found in encodeURI(), decodeURI(), encodeURIComponent(), decodeURIComponent(), escape(), or unescape().
JS Crash Fault Analysis
Obtaining the Log
The process crash log is a type of fault log managed together with the app freeze and JS application crash logs by the FaultLogger module. You can obtain process crash logs using any of the following methods:
Method 1: DevEco Studio
DevEco Studio collects process crash logs in /data/log/faultlog/faultlogger/ and archives the logs in FaultLog. For details, see DevEco Studio User Guide-Fault Log.
Method 2: HiAppEvent APIs
HiAppEvent provides APIs to subscribe to various fault information. For details, see Introduction to HiAppEvent.
Method 3: Shell
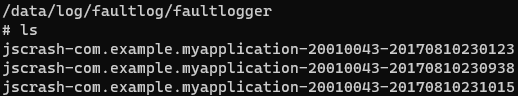
When a process crashes, you can find fault logs in /data/log/faultlog/faultlogger/ on the device. The log files are named in the format of jscrash-process name-process UID-time (milliseconds).log. They contain information such as the device name, system version, and process crash call stack.
Analyzing Faults
Generally, the cause of the fault can be found by locating the problematic code based on the exception scenario, error message, and call stack. The call stack is analyzed in the following cases:
1. StackTrace Scenarios
In JS Crash fault logs, the StackTrace field provides the call stack information about the JS Crash exception. Common StackTrace information includes the following:
The stack top indicates the problematic code, as shown in the following example. You can click the link to locate the problematic code.
Device info:xxx
Build info:xxx-xxx x.x.x.xxx(xxxx)
Fingerprint:ed1811f3f5ae13c7262b51aab73ddd01df95b2c64466a204e0d70e6461cf1697
Timestamp:xxxx-xx-xx xx:xx:xx.xxx
Module name:com.xxx.xxx
Version:1.0.0
VersionCode:1000000
PreInstalled:No
Foreground:Yes
Pid:31255
Uid:20020145
Process Memory(kB): 1897(Rss)
Device Memory(kB): Total 1935820, Free 482136, Available 1204216
Reason:Error
Error name:Error
Error message:JSERROR
Sourcecode:
                throw new ErrOr("JSERROR");
                      ^
Stacktrace:
    at anonymous entry (entry/src/main/ets/pages/Index.ets:13:19)
If “Stack Cannot get SourceMap info, dump raw stack” is displayed in the call stack, as shown in the following example, the system fails to retrieve information from SourceMap and only displays the row number of the problematic code in the compiled code in an eTS stack. You can click the link to identify where the error occurred in the compiled code.
Device info:xxx
Build info:xxx-xxx x.x.x.xxx(xxxx)
Fingerprint:a370fceb59011d96e41e97bda139b1851c911012ab8c386d1a2d63986d6d226d
Timestamp:xxxx-xx-xx xx:xx:xx.xxx
Module name:com.xxx.xxx
Version:1.0.0
VersionCode:1000000
PreInstalled:No
Foreground:Yes
Pid:39185
Uid:20020145
Process Memory(kB): 1897(Rss)
Device Memory(kB): Total 1935820, Free 482136, Available 1204216
Reason:Error
Error name:Error
Error message:JSERROR
Stacktrace:
Cannot get SourceMap info, dump raw stack:
    at anonymous entry (entry/src/main/ets/pages/Index.ts:49:49)
If “SourceMap is not initialized yet” is displayed in the call stack, as shown in the following example, SourceMap has not been initialized and the row number of the problematic code in the compiled code in an eTS stack is displayed. In this case, this log is added to notify developers. You can click the link to identify where the error occurred in the compiled code. The following is an example.
Device info:xxx
Build info:xxx-xxx x.x.x.xxx(xxxx)
Fingerprint:377ef8529301363f373ce837d0bf83aacfc46112502143237e2f4026e86a0510
Timestamp:xxxx-xx-xx xx:xx:xx.xxx
Module name:com.xxx.xxx
Version:1.0.0
Versioncode:1000000
PreInstalled:No
Foreground:Yes
Pid:6042
Uid:20020145
Process Memory(kB): 1897(Rss)
Device Memory(kB): Total 1935820, Free 482136, Available 1204216
Reason:Error
Error name:Error
Error message:JSERROR
Sourcecode:
            throw new Error("JSERROR");
                  ^
Stacktrace:
SourceMap is not initialized yet
at anonymous entry (entry/src/main/ets/pages/Index.ts:49:49)
The native stack is printed in the call stack, as shown in the following example. Generally, the libark_jsruntime.so dynamic library is at the top of the stack. This is because JS exceptions are thrown by the VM. Search for the error from the top down. Generally, the next frame of libace_napi.z.so is the location where an exception is thrown. The following is an example.
Device info:xxx
Build info:xxx-xxx x.x.x.xxx(xxxx)
Fingerprint:89f2b64b24d642b0fc64e3a7cf68ca39fecaa580ff5736bb9d6706ea4cdf2c93
Timestamp:xxxx-xx-xx xx:xx:xx.xxx
Module name:com.xxx.xxx
Version:1.0.0
VersionCode:1000000
PreInstalled:No
Foreground:No
Pid:14325
Uid:20020145
Process Memory(kB): 1897(Rss)
Device Memory(kB): Total 1935820, Free 482136, Available 1204216
Reason:ReferenceError
Error name:ReferenceError
Error message:Cannot find module 'com.xxx.xxx/entry/EntryAbility' , which is application Entry Point
Stacktrace:
SourceMap is not initialized yet
#01 pc 000000000028ba3b /system/lib64/platformsdk/libark_jsruntime.so(bf6ea8e474ac3e417991f101e062fa90)
#02 pc 00000000001452ff /system/lib64/platformsdk/libark_jsruntime.so(bf6ea8e474ac3e417991f101e062fa90)
#03 pC 0000000000144c9f /system/lib64/platformsdk/libark_jsruntime.so(bf6ea8e474ac3e417991f101e062fa90)
#04 pc 00000000001c617b /system/lib64/platformsdk/libark_jsruntime.so(bf6ea8e474ac3e417991f101e062fa90)
#05 pc 00000000004c3cb7 /system/lib64/platformsdk/libark_jsruntime.so(bf6ea8e474ac3e417991f101e062fa90)
#06 pc 00000000004c045f /system/lib64/platformsdk/libark_jsruntime.so(bf6ea8e474ac3e417991f101e062fa90)
#07 pc 000000000038034f /system/lib64/platformsdk/libark_jsruntime.so(bf6ea8e474ac3e417991f101e062fa90)
#08 pc 00000000004b2d9b /system/lib64/platformsdk/libark_jsruntime.so(bf6ea8e474ac3e417991f101e062fa90)
#09 pc 0000000000037e7f /system/lib64/platformsdk/libace_napi.z.so(10ceafd39b5354314d2fe3059b8f9e4f)
#10 pc 00000000000484cf /system/lib64/platformsdk/libruntime.z.so(3f6305a3843fae1de148a06eec4bd014) <- Location where an exception is thrown
#11 pc 000000000004fce7 /system/lib64/platformsdk/libruntime.z.so(3f6305a3843fae1de148a06eec4bd014)
#12 pc 000000000004e9fb /system/lib64/platformsdk/libruntime.z.so(3f6305a3843fae1de148a06eec4bd014)
#13 pc 000000000004eb7b /system/lib64/platformsdk/libruntime.z.so(3f6305a3843fae1de148a06eec4bd014)
#14 pc 000000000004f5c7 /system/lib64/platformsdk/libruntime.z.so(3f6305a3843fae1de148a06eec4bd014)
#15 pc 00000000000303cf /system/lib64/platformsdk/libuiabilitykit_native.z.so(3203F4CCe84a43b519d0a731dfOdb1a3)
2. Call Stack Analysis
Perform call stack analysis as follows:
- Case 1: A hyperlink is provided to go to the problematic code.
If the path or offset address in the stack trace information in the FaultLog points to a line of code of the current project, a hyperlink is provided. You can click the link in DevEco Studio to locate the code line.
- Case 2: The hyperlink provided to go to the problematic code does not work.
If “Cannot get Source Map info, dump raw stack” is displayed, the JS stack fails to obtain the row and column numbers for the problematic code. In this case, clicking the provided hyperlink in DevEco Studio navigates you to an incorrect position or displays an error that indicates the position does not exist.
When an error occurs during the running of application code, the error stack information is printed. If the TS stack fails to obtain the row and column numbers for ArkTS code, the filename extension of the error stack is still “ets”. You need to compile the intermediate product in the build directory to generate TS code and locate the problematic code in JS. For details, see Stack Trace Analysis.
Case Study
The following describes the most common error types, namely, TypeError and Error, that cause JS crashes.
TypeError Analysis
As one of the most common errors that cause JS crashes, TypeError is thrown when the variable type is not the expected one. In other words, the variable is not verified before use. The error message is as follows:
Error name:TypeError
Error message:Cannot read property xxx of undefined
Case 1: JS crash occasionally occurs when a gesture value is updated.
Obtain the JS crash log:
Generated by HiviewDFX@OpenHarmony
================================================================
Device info:xxxx
Build info:xxxx
Fingerprint:9851196f9fed7fd818170303296ae7a5767c9ab11f38fd8b0072f0e32c42ea39
Timestamp:xxxx-xx-xx xx:xx:xx.xxx
Module name:com.xxx.xxx
Version:1.0.0.29
VersionCode:10000029
PreInstalled:Yes
Foreground:No
Pid:2780
Uid:20020018
Process Memory(kB): 1897(Rss)
Device Memory(kB): Total 1935820, Free 482136, Available 1204216
Reason:TypeError
Error name:TypeError
Error message:Cannot read property needRenderTranslate of undefined
Stacktrace:
Cannot get SourceMap info, dump raw stack:
    at updateGestureValue entry (phone/src/main/ets/SceneBoard/recent/scenepanel/recentpanel/RecentGesture.ts:51:51)
    at onRecentGestureActionBegin entry (phone/src/main/ets/SceneBoard/scenemanager/SCBScenePanel.ts:5609:5609)
    at anonymous entry (phone/src/main/ets/SceneBoard/scenemanager/SCBScenePanel.ts:555:555)
    at anonymous entry (phone/src/main/ets/SceneBoard/recent/RecentEventView.ts:183:183)
Analyze log information.
According to the log information, TypeError is reported because the needRenderTranslate object is undefined. Then, obtain the error location based on the stack trace.
If “Cannot get SourceMap info, dump raw stack” is displayed, the application is installed using a release package and the eTS row and column numbers cannot be converted from the JS stack. You can refer to Stack Trace Analysis to parse the row number.
Locate the error code.
Based on the preceding JS stack and error variable analysis, the error code can be located as follows:
  // Update the gesture value.
  public updateGestureValue(screenWidth: number, recentScale: number, sceneContainerSessionList: SCBSceneContainerSession[]) {
    // Calculate the moving distance of the hand.
    this.translationUpY = (this.multiCardsNum >= 1)? sceneContainerSessionList[this.multiCardsNum - 1].needRenderTranslate.translateY: 0; ---> Number of the error line
    this.translationDownY = (this.multiCardsNum >= 2) ? sceneContainerSessionList[this.multiCardsNum - 2].needRenderTranslate.translateY : 0;
    this.screenWidth = px2vp(screenWidth);
    this.recentScale = recentScale;
  }
Solution
According to the preceding analysis, the member variable needRenderTranslate of sceneContainerSessionList may be undefined. A protection needs to be added to avoid this type of problem. For example, you can add a ‘?’ operator before the access object for protection.
// Update the gesture value.
public updateGestureValue(screenWidth: number, recentScale: number, sceneContainerSessionList: SCBSceneContainerSession[]) {
  // Calculate the moving distance of the hand.
  this.translationUpY = (this.multiCardsNum >= 1) ?
    sceneContainerSessionList[this.multiCardsNum - 1]?.needRenderTranslate.translateY : 0;
  this.translationDownY = (this.multiCardsNum >= 2) ?
    sceneContainerSessionList[this.multiCardsNum - 2]?.needRenderTranslate.translateY : 0;
  this.screenWidth = px2vp(screenWidth);
  this.recentScale = recentScale;
}
Suggestions
To solve this problem, we need to add necessary null checks in the coding phase to ensure security of object access. In many scenarios, the null check may only be a workaround. You need to check the object construction or value assignment logic based on service requirements.
Error Analysis
Error problems are JS exceptions thrown by developers or JS libraries.
There are two scenarios for this type of problem:
- If the application encounters a fault that cannot be rectified, a JS exception is thrown to terminate the service and generate a fault log.
- The service is terminated by an exception thrown by an API of the dependent JS library or module. In this case, you need to consider using try-catch to capture such exceptions.
Case 1: Throw a custom JS exception to terminate an application.
You can use the following code to throw a JS exception:
throw new Error("TEST JS ERROR")
Based on the fault logs collected by DevEco Studio FaultLog, you can locate the exception based on the JS exception stack.
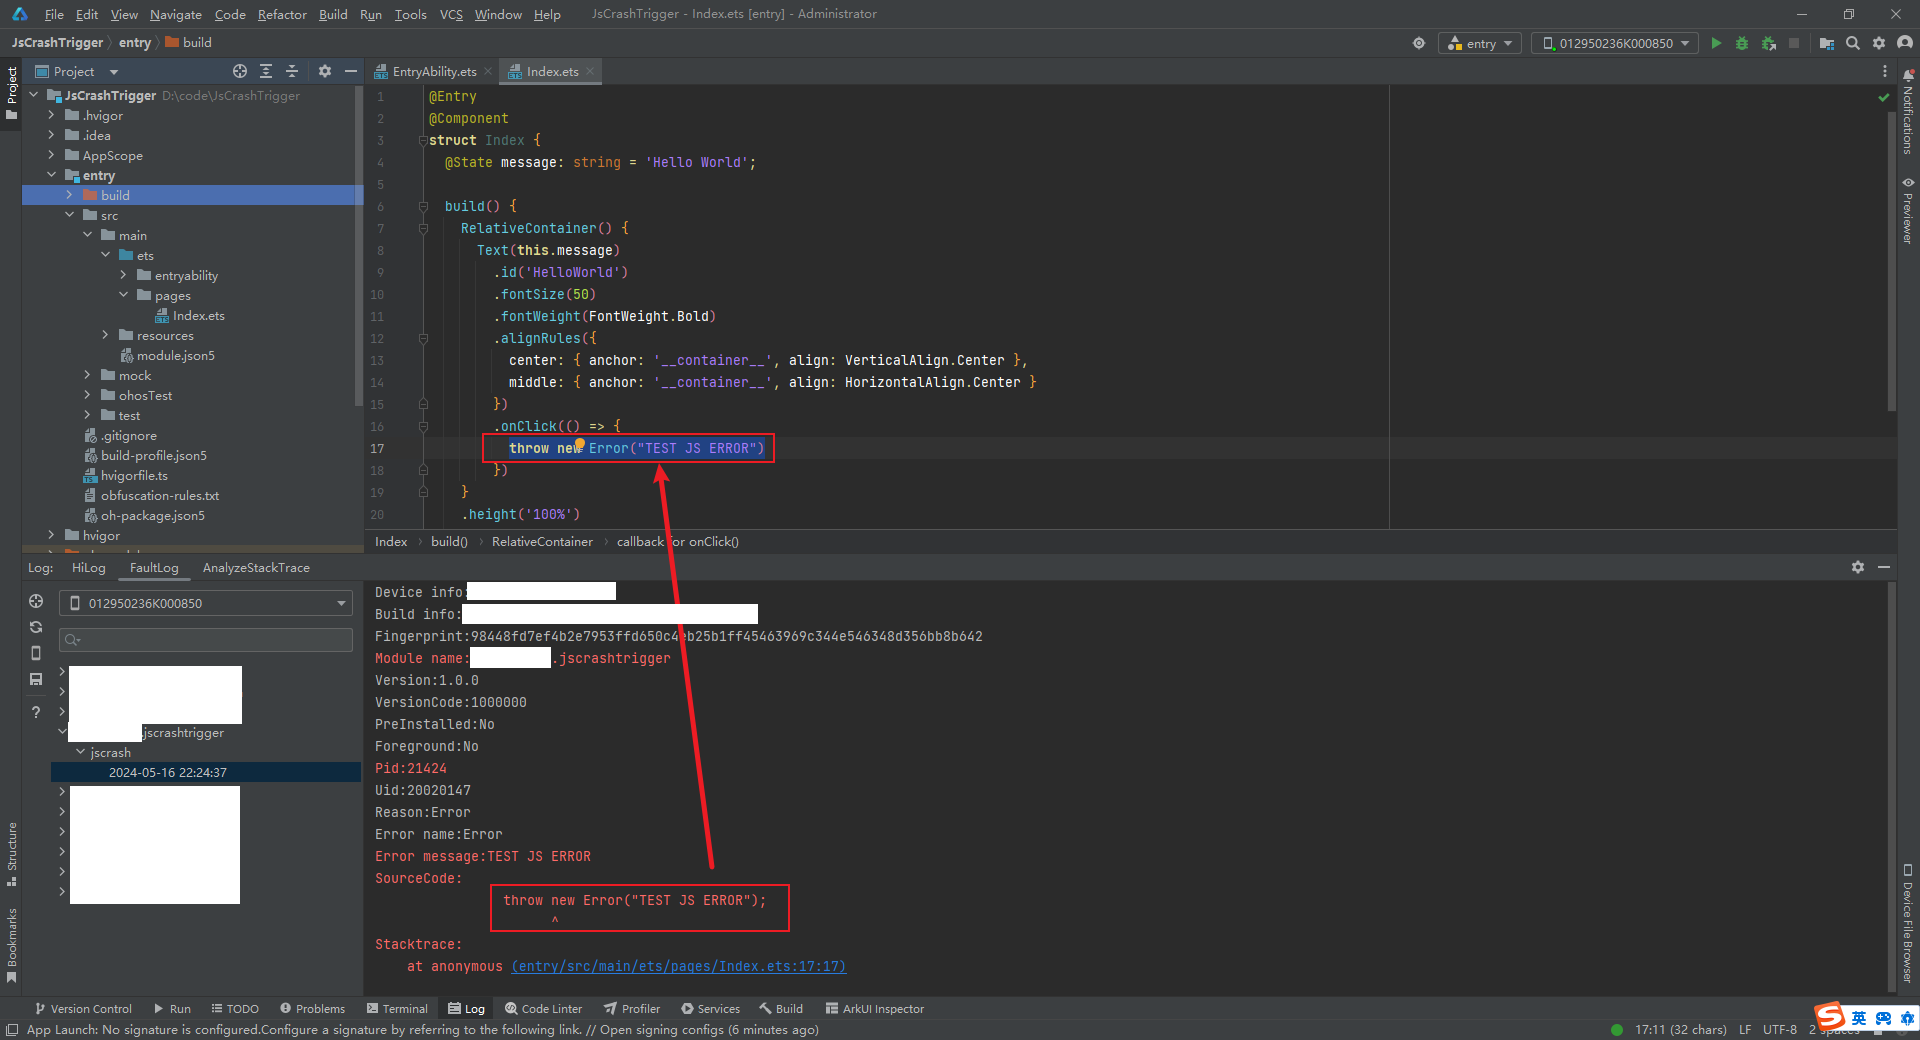
To solve this problem, locate the problematic code line based on the fault log and review the context.
Case 2: Handle the JS crash caused by a JS exception thrown by a third-party API.
Obtain the JS crash log. The key log information is as follows:
Error name:Error
Error message:BussinessError 2501000: Operation failed.
Error code:2501000
Stacktrace:
Cannot get SourceMap info, dump raw stack:
  at onStart entry (product/phone/build/default/cache/default/default@CompileArkTS/esmodule/release/feature/systemstatus/linkspeedcomponent/src/main/ets/default/controller/NetSpeedController.ts:50:1)
  at NetSpeedController entry (product/phone/build/default/cache/default/default@CompileArkTS/esmodule/release/feature/systemstatus/linkspeedcomponent/src/main/ets/default/controller/NetSpeedController.ts:43:43)
  at getInstance entry (product/phone/build/default/cache/default/default@CompileArkTS/esmodule/release/staticcommon/basiccommon/src/main/ets/component/utils/SingletonHelper.ts:17:17)
  at func_main_0 entry (product/phone/build/default/cache/default/default@CompileArkTS/esmodule/release/feature/systemstatus/linkspeedcomponent/src/main/ets/default/controller/NetSpeedController.ts:325:325)
Analyze log information.
According to the log information, an Error exception is thrown by the code. Then, obtain the error location based on the stack trace.
If “Cannot get SourceMap info, dump raw stack” is displayed, the application is installed using a release package and the eTS row and column numbers cannot be converted from the JS stack. You can refer to Stack Trace Analysis to parse the row number.
Locate the error code.
Based on the preceding JS stack, you can locate the code in the NetSpeedController.ts file. The exception is thrown when wifiManager.on() is called.
onStart(): void {
  super.onStart();
  log.showInfo('onStart');
  // ...
  wifiManager.on('wifiConnectionChange', (data) => {
    this.isConnected = data === 1 ? true : false;
    this.handleUpdateState();
  });
  wifiManager.on('wifiStateChange', (data) => {
    this.isWifiActive = data === 1 ? true : false;
    this.handleUpdateState();
  });
  // ...
}
Solution
According to the analysis of the source code, wifiManager.on() throws “BussinessError 2501000: Operation failed” occasionally. If this exception does not cause the application to crash, use try-catch to capture and process the exception. Modify the code as follows:
onStart(): void {
  super.onStart();
  log.showInfo('onStart');
  // ...
  try {
    wifiManager.on('wifiConnectionChange', (data) => {
      this.isConnected = data === 1 ? true : false;
      this.handleUpdateState();
    });
  } catch (error) {
    log.showError('wifiConnectionChange error');
  }
  try {
    wifiManager.on('wifiStateChange', (data) => {
      this.isWifiActive = data === 1 ? true : false;
      this.handleUpdateState();
    });
  } catch (error) {
    log.showError('wifiStateChange error');
  }
  // ...
}
Suggestions
For such problems, we can use the JS exception mechanism in the coding phase to identify various exception scenarios. In addition, consider capturing the exceptions thrown by APIs to prevent unnecessary interrupts of the main services of the application.
你可能感兴趣的鸿蒙文章
harmony 鸿蒙Performance Analysis Kit
harmony 鸿蒙Analyzing Application Freeze
harmony 鸿蒙Development of Application Recovery
harmony 鸿蒙Development of Error Manager
harmony 鸿蒙Introduction to HiAppEvent
- 所属分类: 后端技术
- 本文标签:
热门推荐
-
2、 优质文章
-
3、 gt
-
7、 openharmony
-
9、 golang
-
10、 Vue中input框自动聚焦