harmony 鸿蒙Analyzing C++ Crash
Analyzing C++ Crash
A process crash refers to an unexpected exit of an application or a system process. It occurs in the following scenarios:
- The native code does not process C++ crash signals and C++ crash logs are generated.
- The JS/ArkTS code does process exceptions and JS crash logs are generated. For details, see Analyzing JS Crash.
- The application is suspended, AppFreeze logs are generated, and the application is killed and exits. For details, see Analyzing Application Freeze.
- The process exits unexpectedly due to other mechanisms of the system.
This topic describes how to use the detailed system logs to analyze, locate, and rectify C++ crashes. The main contents are as follows:
- Analysis procedure for C++ crash faults, including obtaining logs, analyzing faults, and verifying whether faults are rectified.
- Case Analysis of how to locate, analyze, and rectify common crash faults.
- Some detailed information about how to locate faults in Appendices.
Analysis Procedure
Obtaining Crash Logs
C++ crash logs are managed together with application freeze and JS crash logs by the FaultLogger module. You can obtain C++ crash logs using any of the following methods:
Method 1: DevEco Studio
DevEco Studio collects process crash logs from /data/log/faultlog/faultlogger/ to FaultLog, where logs are displayed by process name, fault, and time. For details about how to obtain logs, see DevEco Studio User Guide-Fault Log.
Method 2: HiAppEvent APIs
HiAppEvent provides APIs to subscribe to various fault information. For details, see Introduction to HiAppEvent.
Method 3: hdc
Enable the developer option and run the *hdc file recv /data/log/faultlog/faultlogger D:* command to export fault logs to the local device. The fault log file name is in the format of cppcrash-process name-process UID-millisecond-level timestamp.log.
Method 4: Shell
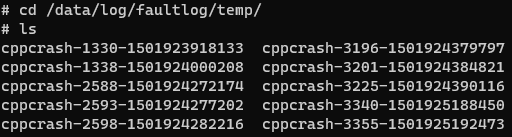
(1) When a process crashes, you can find fault logs in /data/log/faultlog/temp/ on the device. The log file is named in the format of cppcrash-process PID-millisecond-level timestamp. They contain information such as the process crash call stack, process crash register, stack memory, maps, and process file handle list.
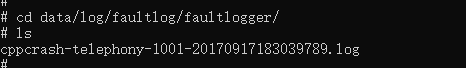
(2) You can find more comprehensive fault logs in /data/log/faultlog/faultlogger/, which include information such as device name, system version and process logs. The log files are named in the format of cppcrash-process name-process UID-time (millisecond).log.
Analyzing C++ Crash Logs
The following describes how to view C++ crash logs and analyze faults. For details about crash logs, see Crash Logs.
Determining Crash Type Based on Signal
The following describes only the crash types corresponding to common signals. For details about other signals, see C++ Crash Signals.
Reason:Signal:SIGSEGV(SI_TKILL)@0x000027e0 from:10208:0
The fields are described as follows:
Reason:Signal:signal value(tkill() function signal)@crash address from:PID of the signal:UID of the signal
Common crash signals:
- SIGSEGV, SIGILL, and SIGBUS. Crashes corresponding to these signals need to be analyzed based on the register. For case analysis, see Case 3: Memory Access Crashes.
- SIGABRT, which indicates that the process automatically aborts. To analyze this fault, you need to check the code that calls abort() in the call stack. For case analysis, see Case 5: SIGABRT Crashes.
Checking Crash Addresses
The Signal field in the C++ crash logs carries the address accessed when the process crashes. For example, if an invalid address is accessed, SIGSEGV is triggered; if a valid address is accessed but the address does not point to a code segment, SIGILL is triggered. In the preceding example, 000027e0 is being accessed when the process crashes.
Checking Register and Stack Address Ranges
Registers:  <- Fault registers
r0:00000000 r1:ffc09854 r2:00000000 r3:00000008
r4:00000000 r5:fffff000 r6:0000000a r7:000000af
r8:ffc09919 r9:ffc09930 r10:00000000
fp:ffc098e8 ip:005b76e4 sp:ffbe8daa lr:005ade99 pc:f7bb0400
cpsr:20870010  <- Status register (The register of the ARM32 architecture is cpsr, and the registers of the AArch64 architecture are pstate and esr.)
...
Maps:
...
ffbe9000-ffc0a000 rw-p 00000000 [stack] <- Stack address range. sp is smaller than the low address ffbe9000 of the stack.
Check the address stored in the stack pointer (sp). If the address is out of the stack address range or close to the low address of the stack, stack overflow may occur. For most stack overflow problems, C++ crash logs also provide prompt information, which can be used as a reference. For details, see Stack Overflows.
Locating the Problematic Code Based on the Crash Stack
Method 1: DevEco Studio
In application development, you can use DevEco Studio to locate the problematic code of the dynamic library in the C++ crash stack. Both native stack frames and JS stack frames are supported. For some stack frames that fail to be parsed and located in DevEco Studio, refer to Method 2.
Method 2: SDK llvm-addr2line
(1) Obtain the .so file with symbols in the crash stack. Ensure that the file version is the same as that of the running application or system. Compiled and built in DevEco Studio, the .so file of dynamic library is generated with symbols by default in /build/default/intermediates/libs. You can run the Linux file command to check whether the BuildID of two .so files match. Generated by the compiler, BuildID uniquely identifies a binary file, and not stripped indicates that a symbol table is included.
$ file libbabel.so
libbabel.so: ELF 64-bit LSB shared object, ARM aarch64, version 1 (SYSV), dynamically linked, BuildID[sha1]=fdb1b5432b9ea4e2a3d29780c3abf30e2a22da9d, with debug_info, not stripped
In the preceding example, the BuildID of the libbabel.so. file is fdb1b5432b9ea4e2a3d29780c3abf30e2a22da9d. Check whether it is the same as that in the C++ crash logs.
#00     pc 000072e6       /system/lib/libbabel.so(xxxxxxx(void*)+30)(fdb1b5432b9ea4e2a3d29780c3abf30e2a22da9d)
#No.   pc pc offset in the segment   Name of the segment to which the pc belongs(Function name + Number of offset bytes in the function)(BuidldID)
pc: Program Counter, which indicates the address of the instruction being executed by the program.
The preceding information shows that the two libbabel.so files match. Then, you can proceed with the following analysis process.
(2) Locate the line number of the problematic code using llvm-addr2line. You can obtain llvm-addr2line from [SDK DIR PATH]/default/openharmony/native/llvm/bin, or you need to search for the path as it varies based on the SDK version. The following is an example of a core call stack:
# 00 pc 00003510 /data/storage/el1/bundle/libs/arm/libentry.so(TriggerCrash(napi_env__*, napi_callback_info__*)+24)(446ff75d3f6a518172cc52e8f8055650b02b0e54)
# 01 pc 0002b0c5 /system/lib/platformsdk/libace_napi.z.so(panda::JSValueRef ArkNativeFunctionCallBack<true>(panda::JsiRuntimeCallInfo*)+448)(a84fbb767fd826946623779c608395bf)
# 02 pc 001e7597 /system/lib/platformsdk/libark_jsruntime.so(panda::ecmascript::EcmaInterpreter::RunInternal(panda::ecmascript::JSThread*, unsigned char const*, unsigned long long*)+14710)(106c552f6ce4420b9feac95e8b21b792)
# 03 pc 001e0439 /system/lib/platformsdk/libark_jsruntime.so(panda::ecmascript::EcmaInterpreter::Execute(panda::ecmascript::EcmaRuntimeCallInfo*)+984)(106c552f6ce4420b9feac95e8b21b792)
...
# 39 pc 00072998 /system/lib/ld-musl-arm.so.1(libc_start_main_stage2+56)(5b1e036c4f1369ecfdbb7a96aec31155)
# 40 pc 00005b48 /system/bin/appspawn(_start_c+84)(cb0631260fa74df0bc9b0323e30ca03d)
# 41 pc 00005aec /system/bin/appspawn(cb0631260fa74df0bc9b0323e30ca03d)
Parsed by SDK llvm-addr2line, the line number of problematic code is as follows:
[SDK DIR PATH]\OpenHarmony\11\native\llvm\bin> .\llvm-addr2line.exe -Cfie libentry.so 3150
TrggerCrash(napi_env__*, napi_callback_info__*)
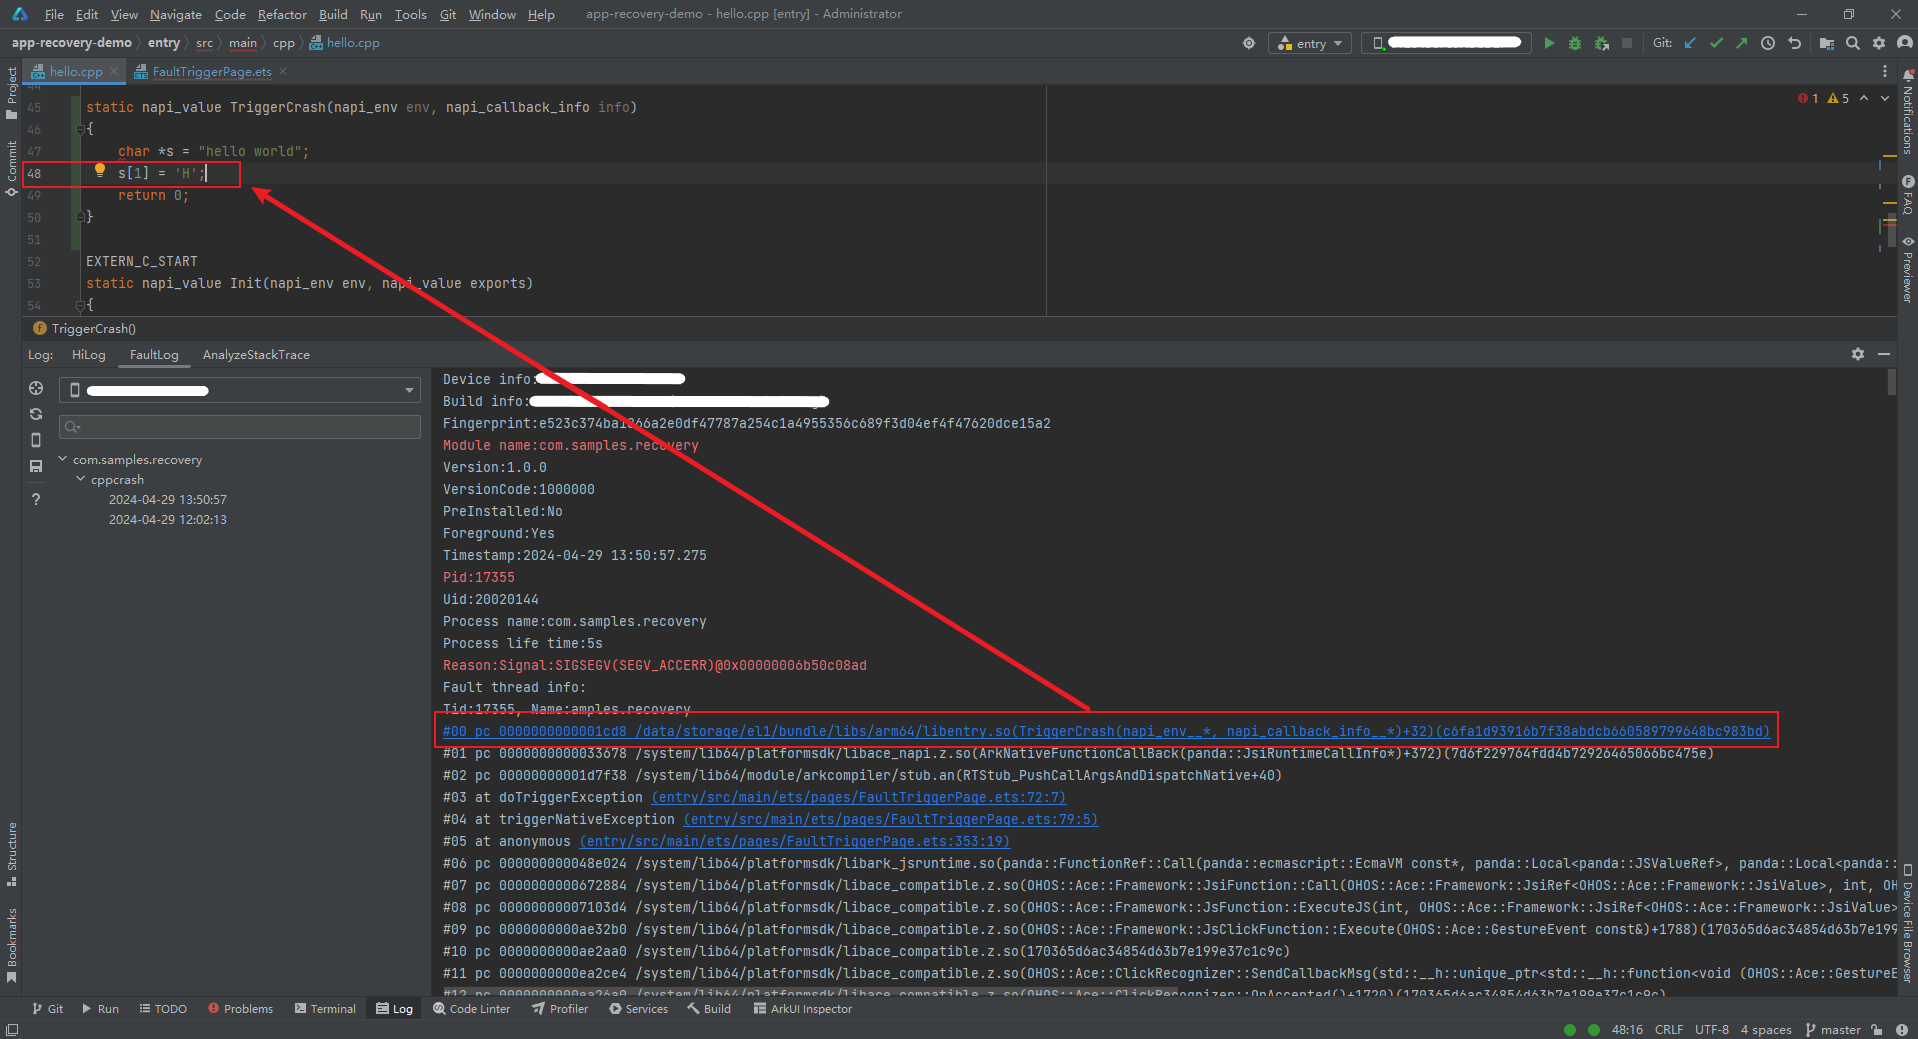
D:/code/apprecovery-demo/entry/src/main/cpp/hello.cpp:48
You can run the llvm-addr2line.exe -fCpie libutils.z.so pc offset in the segment command to parse an offset or the llvm-addr2line.exe -fCpie libxxx.so 0x1bc868 0x1be28c command to parse multiple offsets. If the line number obtained through llvm-addr2line is incorrect based on the source code analysis, you can slightly adjust the address (for example, subtract 1 from the address) or disable some compilation optimization.
Method 3: hstack of DevEco Studio
hstack is a tool provided by DevEco Studio for you to restore the obfuscated crash stack of a release application to the source code stack. It runs on Windows, macOS, and Linux. For details, see hstack.
Reviewing Code Based on Services
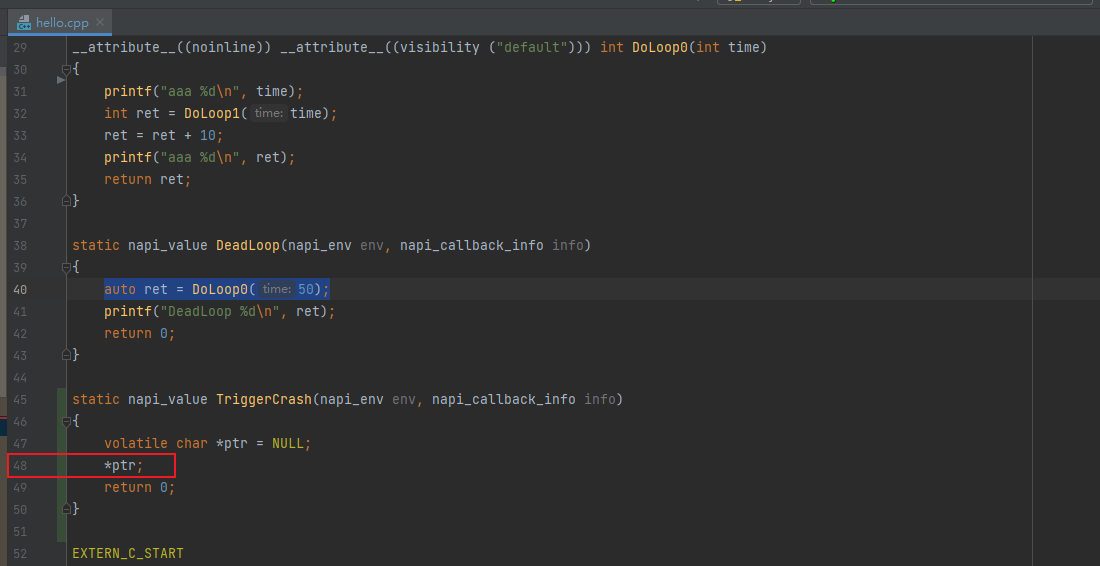
After analyzing the C++ crash logs and locating the line number, check the context in the code and find out the service logic that causes the crash. Based on the crash logs provided by HiLog, analyze the service scenario and find out the suspicious codes. As shown in the following figure, line 48 in the hello.cpp file indicates a null pointer dereference.
This example is constructed, and actual scenario is usually more complicate and needs to be analyzed based on services.
Disassembling (Optional)
If you are familiar with the service process and want to solve a simple problem where the crash occurs, you can locate the problem by analyzing the service code. However, in some complex scenarios, for example, when the method called in a line has multiple parameters, the problem cannot be directly analyzed based on the code. In this case, you need analyze the problem by disassembling the code. For details, see Reading Assembly Instructions.
Analyzing Memory Corruption (Optional)
Memory corruption indicates that the service code uses a valid wild pointer (a pointer to a random memory area) during execution and changes the memory it points to into an invalid value. As a result, the original data stored in the memory is changed, and a crash event occurs when the data is accessed again.
In this case, a random crash call stack is generated and it is difficult to locate the root cause.
To analyze a memory corruption problem, perform the following steps:
Locating the Scenario Where the Problem Occurs
Based on the crash logs provided by HiLog, analyze the problem scenario. For example, a problem occurs when a user switches from page 1 to page 2 of an application.
After finding out the scenario, you can determine the codes used in the process and perform tests accordingly. Prioritize the locating of problem scenarios, which is critical to reproducing and analyzing the problem and verifying whether it is fixed.
Analyzing Memory Features and Checking Whether It Is Rewritten
The system memory allocator is based on thread affinity, that is, the memory released in a thread is preferentially allocated to the next applicant of the current thread. Therefore, if most faults occur in the same thread, the service that causes memory corruption is related to the crash thread. In this way, you can narrow down the troubleshooting scope.
When the memory that a process accesses is written with information, the possible situations are as follows:
- The information is written by the service that illegally accesses the memory. You can find the module where the service is located based on the information.
- The memory is released by the service that illegally accesses it, but another service writes information to the memory. Therefore, the service that illegally accesses the memory cannot be found directly.
Common analysis steps:
- Based on the service code, obtain the corrupted memory and its size by reading assembly instructions.
- Based on MemoryNearRegister in the C++ crash logs, obtain the features of the corrupted memory.
- If the memory features are obvious, for example, the memory contains ASCII code values of strings (continuous values ranging from 0x20 to 0x7e) or other regular values, the service that causes memory corruption may be quickly located. If no such features exist, continue the analysis.
Deploying the Test Environment and Using HWASan to Analyze Problems
(1) Reproduce the problem, and enable HWASan for detecting memory errors to find the site where the service that changes the memory to an invalid value. This is critical for problem analysis.
(2) Deploy the test environment based on the scenario where the problem occurs and evaluate the pressure test duration based on the probability of the problem.
If the problem does not recur for a long time, the test scenario is incorrect. In this case, you need to analyze the efficient scenario based on the onsite logs such as HiLog logs.
(3) Analyze whether there are external modules that may cause the problem.
For example, when a memory corruption problem occurs during video playback, the HiLog information shows that external modules always report poor Wi-Fi signals during the period when the problem occurs. Therefore, it is suspected that the memory corruption problem is related to network delay. After the test environment is set up and the problem is reproduced, the assumption is verified.
(4) Narrow down the scope of the faulty module by excluding unrelated functionalities.
Specifically, disable the functionality one by one until the problem cannot be reproduced. In this way, the problem can be located. This step requires you to be familiar with the modules and may be costly. Therefore, you can use the binary search to locate the bottleneck.
Checking Whether the Problem Is Rectified
After the problem is rectified based on the analysis conclusion, deploy the test environment to simulate the scenario where the problem occurs. Evaluate the test duration based on the problem occurrence probability. If the problem does not recur within the test duration, the fault is considered rectified. Otherwise, continue to check other suspicious codes. Note that the fault is only considered rectified if the problem does not recur within the test duration.
Case Analysis
Case 1: Null Pointer Dereference
Background
Smart pointers are used without null checks, causing null pointer dereference crashes during process execution.
Impact
The process crashes and cannot run stably, resulting in an unexpected exit.
Fault Analysis
Null pointer crashes can be identified based on the fault cause. Run the llvm-addr2line command to parse the line number. It is found that the service code does not check whether the smart pointer is null before using it. As a result, the service code accesses the null address, causing the crash.
Solution
Add protective null checks for the pointer.
Suggestions
Pointers should be null-checked before using it to prevent null pointers and process crashes and exits.
Case 2: Multi-thread Competition
Background
napi_env is still used after being released.
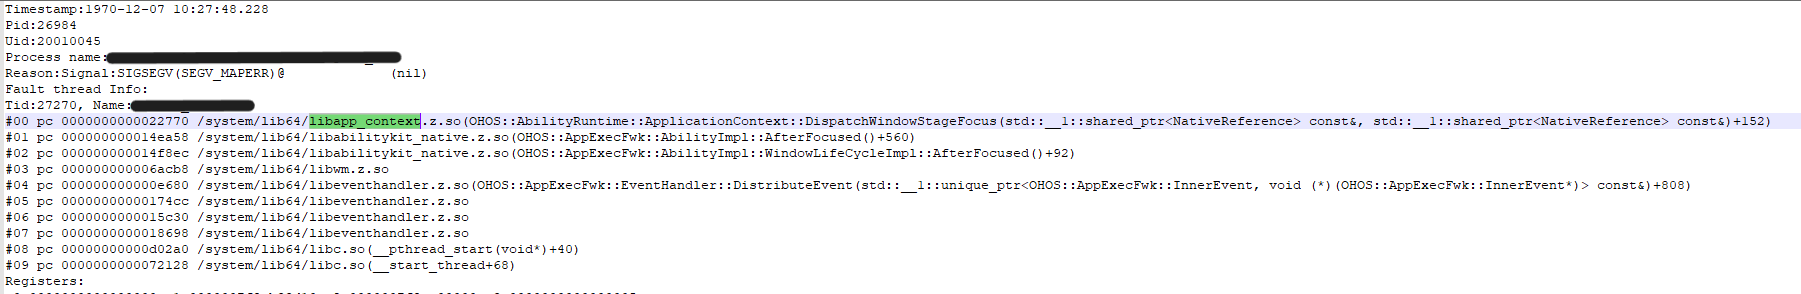
Symptom The key crash stack is as follows.
The env (in JavaScript environment) of the Node-API points to an invalid memory, and the crash stack is mounted to NativeEngineInterface::ClearLastError(). By using profiling loggings and analyzing service processes before the crash event based on HiLog logs, the address of the env is located and it is found that the env is still used after being released.
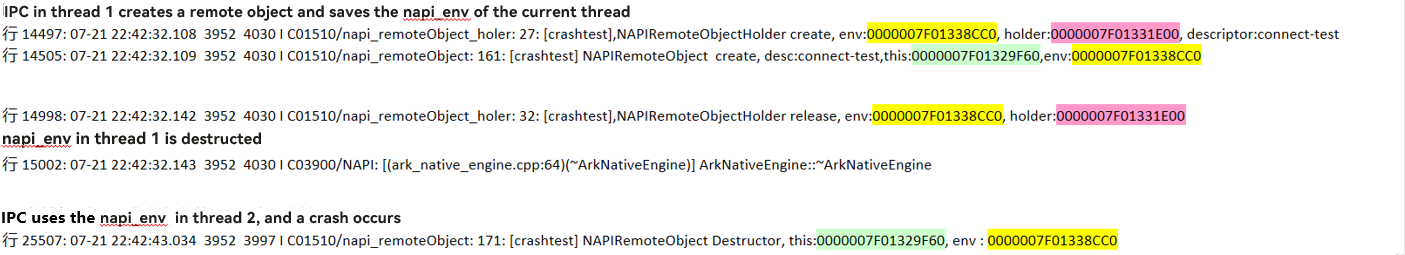
JavaScript is executed by a single thread. Therefore, any operation on env must be performed on the original thread that creates the JavaScript thread. Otherwise, unexpected problems may occur.
Solutions
Do not transfer the env created by a thread to other threads.
Suggestions
If the stack top often crashes when env operations are performed in libraries such as libace_napi.z.so and libark_jsruntime.so, and the crash cause cannot be directly analyzed based on the call stack of the C ++ crash logs, you can enable multi-thread check to quickly locate the fault. In addition, when the STL container (such as vector, map, and set) is added or deleted by multiple threads, the SIGSEGV fault is likely to occur because the STL container is not thread-safe. Therefore, in scenarios where multiple threads perform operations on the STL container, the fault may be caused by multi-thread competition.
Case 3: Memory Access Crash
Background
The crash address is in the readable and executable segment of libace_napi_ark.z.so. The cause is that the address needs to be written, but the corresponding maps segment has only the read and execute permissions. In other words, when a process attempts to access a memory area that is not allowed to be accessed, the process crashes.
7f82740000-7f8275c000 r--p 00000000 /system/lib64/libace_napi_ark.z.so
7f8275c000-7f8276e000 r-xp 0001b000 /system/lib64/libace_napi_ark.z.so <- The crash address locates within this address range.
7f8276e000-7f82773000 r--p 0002c000 /system/lib64/libace_napi_ark.z.so
7f82773000-7f82774000 rw-p 00030000 /system/lib64/libace_napi_ark.z.so
The following figure shows the crash call stack.

Fault Analysis
According to the service logic, the node should be stored in the heap and its address cannot be in the code segment of libace_napi_ark.z.so. Therefore, there is a high probability that the problem is caused by memory corruption. In this case, you can use HWASan to locate the memory corruption problem. To find the regular crash scenario, you can use ASan to reproduce the problem. The result shows that the fault detected by ASan is the same as that in the crash stack. The ASan log shows that the memory corruption type is heap-use-after-free. Based on the log information, find out the process from memory application, memory release, to use of the released memory. After analysis, it can be determined that the service code repeatedly releases the same address (0x003a375eb724) and uses this address to access object members. As a result, the use-after-free issue is reported. The core ASan logs are as follows:
=================================================================
==appspawn==2029==ERROR: AddressSanitizer: heap-use-after-free on address 0x003a375eb724 at pc 0x002029ba8514 bp 0x007fd8175710 sp 0x007fd8175708
READ of size 1 at 0x003a375eb724 thread T0 (thread name) <- The released memory is used.
    # 0 0x2029ba8510  (/system/asan/lib64/platformsdk/libark_jsruntime.so+0xca8510) panda::ecmascript::Node::IsUsing() const at arkcompiler/ets_runtime/ecmascript/ecma_global_storage.h:82:16
(inlined by) panda::JSNApi::DisposeGlobalHandleAddr(panda::ecmascript::EcmaVM const*, unsigned long) at arkcompiler/ets_runtime/ecmascript/napi/jsnapi.cpp:749:67 BuildID[md5/uuid]=9a18e2ec0dc8a83216800b2f0dd7b76a
    # 1 0x403ee94d30  (/system/asan/lib64/libace.z.so+0x6194d30) panda::CopyableGlobal<panda::ObjectRef>::Free() at arkcompiler/ets_runtime/ecmascript/napi/include/jsnapi.h:1520:9
(inlined by) panda::CopyableGlobal<panda::ObjectRef>::Reset() at arkcompiler/ets_runtime/ecmascript/napi/include/jsnapi.h:189:9
(inlined by) OHOS::Ace::Framework::JsiType<panda::ObjectRef>::Reset() at foundation/arkui/ace_engine/frameworks/bridge/declarative_frontend/engine/jsi/jsi_types.inl:112:13
(inlined by) OHOS::Ace::Framework::JsiWeak<OHOS::Ace::Framework::JsiObject>::~JsiWeak() at foundation/arkui/ace_engine/frameworks/bridge/declarative_frontend/engine/jsi/jsi_ref.h:167:16
(inlined by) OHOS::Ace::Framework::ViewFunctions::~ViewFunctions() at foundation/arkui/ace_engine/frameworks/bridge/declarative_frontend/jsview/js_view_functions.h:44:5 BuildID[md5/uuid]=1330f8b9be73bdb76ae18107c2a60ca1
    # 2 0x403ee9296c  (/system/asan/lib64/libace.z.so+0x619296c) OHOS::Ace::Framework::ViewFunctions::~ViewFunctions() at foundation/arkui/ace_engine/frameworks/bridge/declarative_frontend/jsview/js_view_functions.h:42:5
(inlined by) OHOS::Ace::Framework::ViewFunctions::~ViewFunctions() at foundation/arkui/ace_engine/frameworks/bridge/declarative_frontend/jsview/js_view_functions.h:42:5 BuildID[md5/uuid]=1330f8b9be73bdb76ae18107c2a60ca1
    # 3 0x403ed9b130  (/system/asan/lib64/libace.z.so+0x609b130) OHOS::Ace::Referenced::DecRefCount() at foundation/arkui/ace_engine/frameworks/base/memory/referenced.h:76:13
(inlined by) OHOS::Ace::RefPtr<OHOS::Ace::Framework::ViewFunctions>::~RefPtr() at foundation/arkui/ace_engine/frameworks/base/memory/referenced.h:148:22 BuildID[md5/uuid]=1330f8b9be73bdb76ae18107c2a60ca1
    # 4 0x403ed9b838  (/system/asan/lib64/libace.z.so+0x609b838) OHOS::Ace::RefPtr<OHOS::Ace::Framework::ViewFunctions>::Reset() at foundation/arkui/ace_engine/frameworks/base/memory/referenced.h:163:9
(inlined by) OHOS::Ace::Framework::JSViewFullUpdate::~JSViewFullUpdate() at foundation/arkui/ace_engine/frameworks/bridge/declarative_frontend/jsview/js_view.cpp:159:21 BuildID[md5/uuid]=1330f8b9be73bdb76ae18107c2a60ca1
    # 5 0x403ed9bf24  (/system/asan/lib64/libace.z.so+0x609bf24) OHOS::Ace::Framework::JSViewFullUpdate::~JSViewFullUpdate() at foundation/arkui/ace_engine/frameworks/bridge/declarative_frontend/jsview/js_view.cpp:157:1
(inlined by) OHOS::Ace::Framework::JSViewFullUpdate::~JSViewFullUpdate() at foundation/arkui/ace_engine/frameworks/bridge/declarative_frontend/jsview/js_view.cpp:157:1 BuildID[md5/uuid]=1330f8b9be73bdb76ae18107c2a60ca1
...
freed by thread T0 (thread name) here: <- The memory is released.
    # 0 0x2024ed3abc  (/system/asan/lib64/libclang_rt.asan.so+0xd3abc)
    # 1 0x2029ba8424  (/system/asan/lib64/platformsdk/libark_jsruntime.so+0xca8424) std::__h::__function::__value_func<void (unsigned long)>::operator()[abi:v15004](unsigned long&&) const at prebuilts/clang/ohos/linux-x86_64/llvm/bin/../include/libcxx-ohos/include/c++/v1/__functional/function.h:512:16
(inlined by) std::__h::function<void (unsigned long)>::operator()(unsigned long) const at prebuilts/clang/ohos/linux-x86_64/llvm/bin/../include/libcxx-ohos/include/c++/v1/__functional/function.h:1197:12
(inlined by) panda::ecmascript::JSThread::DisposeGlobalHandle(unsigned long) at arkcompiler/ets_runtime/ecmascript/js_thread.h:604:9
(inlined by) panda::JSNApi::DisposeGlobalHandleAddr(panda::ecmascript::EcmaVM const*, unsigned long) at arkcompiler/ets_runtime/ecmascript/napi/jsnapi.cpp:752:24 BuildID[md5/uuid]=9a18e2ec0dc8a83216800b2f0dd7b76a
    # 2 0x403ee94b68  (/system/asan/lib64/libace.z.so+0x6194b68) panda::CopyableGlobal<panda::FunctionRef>::Free() at arkcompiler/ets_runtime/ecmascript/napi/include/jsnapi.h:1520:9
(inlined by) panda::CopyableGlobal<panda::FunctionRef>::Reset() at arkcompiler/ets_runtime/ecmascript/napi/include/jsnapi.h:189:9
(inlined by) OHOS::Ace::Framework::JsiType<panda::FunctionRef>::Reset() at foundation/arkui/ace_engine/frameworks/bridge/declarative_frontend/engine/jsi/jsi_types.inl:112:13
(inlined by) OHOS::Ace::Framework::JsiWeak<OHOS::Ace::Framework::JsiFunction>::~JsiWeak() at foundation/arkui/ace_engine/frameworks/bridge/declarative_frontend/engine/jsi/jsi_ref.h:167:16
(inlined by) OHOS::Ace::Framework::ViewFunctions::~ViewFunctions() at foundation/arkui/ace_engine/frameworks/bridge/declarative_frontend/jsview/js_view_functions.h:44:5 BuildID[md5/uuid]=1330f8b9be73bdb76ae18107c2a60ca1
    # 3 0x403ee9296c  (/system/asan/lib64/libace.z.so+0x619296c) OHOS::Ace::Framework::ViewFunctions::~ViewFunctions() at foundation/arkui/ace_engine/frameworks/bridge/declarative_frontend/jsview/js_view_functions.h:42:5
(inlined by) OHOS::Ace::Framework::ViewFunctions::~ViewFunctions() at foundation/arkui/ace_engine/frameworks/bridge/declarative_frontend/jsview/js_view_functions.h:42:5 BuildID[md5/uuid]=1330f8b9be73bdb76ae18107c2a60ca1
    # 4 0x403ed9b130  (/system/asan/lib64/libace.z.so+0x609b130) OHOS::Ace::Referenced::DecRefCount() at foundation/arkui/ace_engine/frameworks/base/memory/referenced.h:76:13
(inlined by) OHOS::Ace::RefPtr<OHOS::Ace::Framework::ViewFunctions>::~RefPtr() at foundation/arkui/ace_engine/frameworks/base/memory/referenced.h:148:22 BuildID[md5/uuid]=1330f8b9be73bdb76ae18107c2a60ca1
...
previously allocated by thread T0 (thread name) here: <- The memory is allocated.
    # 0 0x2024ed3be4  (/system/asan/lib64/libclang_rt.asan.so+0xd3be4)
    # 1 0x2029ade778  (/system/asan/lib64/platformsdk/libark_jsruntime.so+0xbde778) panda::ecmascript::NativeAreaAllocator::AllocateBuffer(unsigned long) at arkcompiler/ets_runtime/ecmascript/mem/native_area_allocator.cpp:98:17 BuildID[md5/uuid]=9a18e2ec0dc8a83216800b2f0dd7b76a
    # 2 0x2029a39064  (/system/asan/lib64/platformsdk/libark_jsruntime.so+0xb39064) std::__h::enable_if<!std::is_array_v<panda::ecmascript::NodeList<panda::ecmascript::WeakNode>>, panda::ecmascript::NodeList<panda::ecmascript::WeakNode>*>::type panda::ecmascript::NativeAreaAllocator::New<panda::ecmascript::NodeList<panda::ecmascript::WeakNode>>() at arkcompiler/ets_runtime/ecmascript/mem/native_area_allocator.h:61:19
(inlined by) unsigned long panda::ecmascript::EcmaGlobalStorage<panda::ecmascript::Node>::NewGlobalHandleImplement<panda::ecmascript::WeakNode>(panda::ecmascript::NodeList<panda::ecmascript::WeakNode>**, panda::ecmascript::NodeList<panda::ecmascript::WeakNode>**, unsigned long) at arkcompiler/ets_runtime/ecmascript/ecma_global_storage.h:565:34
(inlined by) panda::ecmascript::EcmaGlobalStorage<panda::ecmascript::Node>::SetWeak(unsigned long, void*, void (*)(void*), void (*)(void*)) at arkcompiler/ets_runtime/ecmascript/ecma_global_storage.h:455:26 BuildID[md5/uuid]=9a18e2ec0dc8a83216800b2f0dd7b76a
    # 3 0x2029ba5620  (/system/asan/lib64/platformsdk/libark_jsruntime.so+0xca5620) std::__h::__function::__value_func<unsigned long (unsigned long, void*, void (*)(void*), void (*)(void*))>::operator()[abi:v15004](unsigned long&&, void*&&, void (*&&)(void*), void (*&&)(void*)) const at prebuilts/clang/ohos/linux-x86_64/llvm/bin/../include/libcxx-ohos/include/c++/v1/__functional/function.h:512:16
(inlined by) std::__h::function<unsigned long (unsigned long, void*, void (*)(void*), void (*)(void*))>::operator()(unsigned long, void*, void (*)(void*), void (*)(void*)) const at prebuilts/clang/ohos/linux-x86_64/llvm/bin/../include/libcxx-ohos/include/c++/v1/__functional/function.h:1197:12
(inlined by) panda::ecmascript::JSThread::SetWeak(unsigned long, void*, void (*)(void*), void (*)(void*)) at arkcompiler/ets_runtime/ecmascript/js_thread.h:610:16
(inlined by) panda::JSNApi::SetWeak(panda::ecmascript::EcmaVM const*, unsigned long) at arkcompiler/ets_runtime/ecmascript/napi/jsnapi.cpp:711:31 BuildID[md5/uuid]=9a18e2ec0dc8a83216800b2f0dd7b76a
...
The call stack shows that when JsiWeak is destructed or reset, CopyableGlobal in the parent class JsiType of its member (JsiObject/JsiValue/JsiFunction) is released, as shown in the following figure.

During Garbage Collection (GC), IterateWeakEcmaGlobalStorage calls DisposeGlobalHandle to release WeakNodes without callbacks, as shown in the following figure.
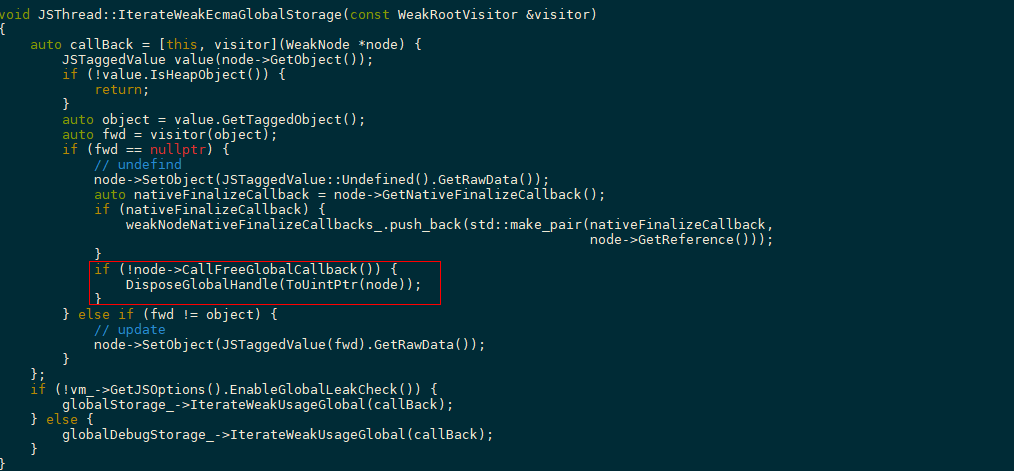
Therefore, for the same WeakNode, there may be two ways for release. Since no callback is sent to JsiWeak for clearing the released WeakNode, JsiWeak still stores a reference to the released WeakNode, that is, CopyableGlobal. In this case, when the NodeList where the WeakNode is located is released and the CopyableGlobal reserved in JsiWeak is released, the memory is repeatedly released.

Solutions
Set a callback for JsiWeak using SetWeakCallback. Therefore, the callback can notify JsiWeak to reset CopyableGlobal when IterateWeakEcmaGlobalStorage releases the WeakNode, ensuring the same address is not repeatedly released.
Suggestions
When using memory, consider whether the memory is repeatedly released or not released. Additionally, when locating memory access crashes (usually SIGSEGV crashes), use HWASan to reproduce the fault if there is no clue based on the call stack analysis.
Case 4: Lifecycle Issue
Lifecycle issues occur when the memory of an object is accessed beyond its lifecycle. Generally, lifecycle issues are caused by improper use of raw pointers. A raw pointer does not have encapsulation or automatic memory management features. It is a simple pointer that points to a memory address without protecting or managing the memory. A raw pointer can directly access the memory, but it may cause memory leaks and null pointer references. To avoid potential security problems, use raw pointers with caution. You are advised to use smart pointers to manage memory.
Background
When you create a native napi_value, it needs to be used with napi_handle_scope. The napi_handle_scope is used to manage the lifecycle of napi_value. napi_value can be used only within napi_handle_scope, otherwise, the lifecycle of napi_value and its JS objects is no longer protected. If the reference count is 0, napi_value is collected by GC. Using napi_value at this point indicates accessing freed memory, which results in faults.
Symptom
napi_value is a raw pointer (a struct pointer). It is used to hold JS objects and maintain the lifecycle of JS objects to ensure that JS objects are not collected by GC. When napi_value is used outside napi_handle_scope, napi_value is collected by GC, and it does not hold the JS object (the lifecycle of the JS object is not protected).
Fault Analysis
Based on the call stack, locate the upper-layer API of the faulty Node-API, find the problematic napi_value, and check whether it is used outside napi_handle_scope.
Cases
napi_value is used outside napi_handle_scope in the following example.
On the JS side, data is added using the Add(), and on the native side, napi_value is saved to a vector. On the JS side, data is obtained using the get API, and on the native side, the saved napi_value is returned as an array. The JS side then reads the properties of the data. The error message “Can not get Prototype on non ECMA Object” is displayed. The native_value across napi is not saved using napi_ref. As a result, the native_value is invalid. > NOTE > > You can manage the lifecycle of napi_value using napi_handle_scope, which starts before the native method is called and ends after the native method is executed. For details, see Performing Lifecycle Management Using Node-API.
Case 5: SIGABRT Crash
SIGABRT crashes usually occur when the process calls the abort function of the standard function library. They are triggered when the program detects exceptions, such as thread creation failure or file descriptor usage exceptions, particularly when basic libraries (such as the C library) perform verifications.
static napi_value TriggerCrash(napi_env env, napi_callback_info info)
{
    OH_LOG_FATAL(LOG_APP, "test fatal log.");
    abort();
    return 0;
}
This example constructs a scenario where the abort function is proactively called to describe how to analyze the SIGABRT crash. As shown in the preceding figure, LastFatalMessage provides the cause of the abnormal exits for the SIGABRT crash, which helps to locate the fault. Skip the call stack of the C library, find the call stack (#02 call stack in the figure) that calls the abort function, and analyze the call stack based on LastFatalMessage.
In C++, the assert function is also used for exception handling. When the assert function is called to verify data during the execution of the current function and the verification fails, the process exits automatically. In this case, the method for analyzing the problem is the same as that for the abort function.
static napi_value TriggerCrash(napi_env env, napi_callback_info info)
{
    void *pc = malloc(1024);
    assert(pc != nullptr);
    return 0;
}
Appendices
C++ Crash Signals
Based on the POSIX signal mechanism, the following crash signals can be detected.
| Signo | Signal | Description | Trigger Cause |
|---|---|---|---|
| 4 | SIGILL | Invalid instruction | An invalid, incorrectly formatted, unknown, or privileged instruction is executed. |
| 5 | SIGTRAP | Breakpoint or trap | An exception occurs or a trap instruction is executed. |
| 6 | SIGABRT | Process abort | The process is aborted abnormally. Generally, this exception occurs when the process calls abort() in the Standard Function Library. |
| 7 | SIGBUS | Illegal memory access | The process accesses an aligned or nonexistent physical address. |
| 8 | SIGFPE | Floating-point exception | An incorrect arithmetic operation is executed, for example, a 0 divisor, floating point overflow, or integer overflow. |
| 11 | SIGSEGV | Invalid memory access | The process accesses an invalid memory region. |
| 16 | SIGSTKFLT | Stack error | The processor performs an incorrect stack operation, such as a pop when the stack is empty or a push when the stack is full. |
| 31 | SIGSYS | Incorrect system call | An incorrect or invalid parameter is used in a system call. |
Some of the preceding signals are further classified into codes based on specific scenarios. SIGILL indicates an invalid instruction exception in Unix and Unix-like operating systems. The trigger causes of SIGILL are as follows.
| Code | Value | Description | Trigger Cause |
|---|---|---|---|
| 1 | ILL_ILLOPC | Illegal operation code. | A privileged instruction or an instruction that is unsupported by the CPU is executed. |
| 2 | ILL_ILLOPN | Illegal operand. | An incorrect operand or improper operand type is used. |
| 3 | ILL_ILLADR | Illegal address. | A program accesses an invalid memory address or an unaligned memory address. |
| 4 | ILL_ILLTRP | Illegal trap. | A program performs an illegal trap instruction or an undefined operation. |
| 5 | ILL_PRVOPC | Illegal privileged operation code. | A common user executes a privileged instruction. |
| 6 | ILL_PRVREG | Illegal privileged register. | A common user accesses a privileged register. |
| 7 | ILL_COPROC | Illegal coprocessor. | A program performs an undefined coprocessor instruction. |
| 8 | ILL_BADSTK | Illegal stack. | A program performs an operation at an invalid stack address, or when the stack overflows. |
SIGTRAP usually occurs in debugging and tracking. The trigger causes of SIGTRAP are as follows.
| Code | Value | Description | Trigger Cause |
|---|---|---|---|
| 1 | TRAP_BRKPT | Software breakpoint. | The program reaches the software breakpoint. When debugging a program, a software breakpoint at the key position can be used to pause the program execution and check information such as variable values. |
| 2 | TRAP_TRACE | Single-step debugging. | The program executes a single instruction. Single instruction can be used to check the execution result of each instruction. |
| 3 | TRAP_BRANCH | Branch tracing. | The program executes a branch instruction. Branch instruction can be used to control the execution process of a program, such as if statements and loop statements. |
| 4 | TRAP_HWBKPT | Hardware breakpoint. | The program reaches the hardware breakpoint. When debugging a program, a hardware breakpoint at the key position can be used to pause the program execution and check information such as variable values. Different from a software breakpoint, a hardware breakpoint is implemented in CPU hardware. Therefore, whether a hardware breakpoint is triggered can be detected in real time during program execution. |
The SIGBUS signal is sent by the operating system to a process. It usually indicates a memory access error. The trigger causes of SIGBUS are as follows.
| Code | Value | Description | Trigger Cause |
|---|---|---|---|
| 1 | BUS_ADRALN | Unaligned memory address. | The program accesses an unaligned memory address, for example, a non-even address of a 4-byte integer. |
| 2 | BUS_ADRERR | Invalid memory address. | The program accesses a memory address that does not exist in the process address space, such as a null pointer. |
| 3 | BUS_OBJERR | Invalid object access. | The program accesses a deleted or uninitialized object. |
| 4 | BUS_MCEERR_AR | Invalid hardware memory check. | A checksum error is detected when the hardware memory is accessed. |
| 5 | BUS_MCEERR_AO | Invalid hardware memory check. | An address check error is detected when the hardware memory is accessed. |
The SIGFPE signal indicates a floating-point exception or an arithmetic exception. The trigger causes of SIGFPE are as follows.
| Code | Value | Description | Trigger Cause |
|---|---|---|---|
| 1 | FPE_INTDIV | Invalid integer division. | The program performs an integer division operation while the divisor is zero. |
| 2 | FPE_INTOVF | Integer overflow. | The program performs an integer operation and the result exceeds the integer range. |
| 3 | FPE_FLTDIV | Invalid floating-point division. | The program performs a floating-point division operation while the divisor is zero. |
| 4 | FPE_FLTOVF | Floating-point overflow error. | The program performs a floating-point operation and the result exceeds the upper limit of the floating-point number. |
| 5 | FPE_FLTUND | Floating-point underflow error. | The program performs a floating-point operation and the result is less than the lower limit of the floating-point number. |
| 6 | FPE_FLTRES | Invalid floating-point result. | The program performs a floating-point operation and the result is undefined. |
| 7 | FPE_FLTINV | Invalid floating-point operation. | A program performs an invalid floating-point operation. |
| 8 | FPE_FLTSUB | Invalid floating-point operation result. | A program attempts to perform a floating-point operation and the floating-point result is out of range. |
SIGSEGV occurs when a process accesses a non-existent memory address or an inaccessible address. The trigger causes of the SIGSEGV signal are described as follows:
| Code | Value | Description | Trigger Cause |
|---|---|---|---|
| 1 | SEGV_MAPERR | Non-existent memory address. | A process accesses a memory address that does not exist or that is not mapped to the process address space. This exception is usually caused by pointer errors or memory leaks. |
| 2 | SEGV_ACCERR | Inaccessible memory address. | A process accesses an inaccessible memory address marked by the operating system, such as a read-only memory address or a memory address without execution permission. This exception is usually caused by buffer overflow or modifying read-only memory. |
The classification of codes cannot only be based on signals, but also on their underlying causes. The code values classified by causes are as follows.
| Code | Value | Description | Trigger Cause |
|---|---|---|---|
| 0 | SI_USER | User space. | A signal sent from a process in user space to another process, usually using kill(). For example, when a user presses Ctrl+C on the terminal, a SIGINT signal is sent to all foreground processes. |
| 0x80 | SI_KERNEL | Kernel. | A signal sent from the kernel to a process when the kernel detects an error or exception. For example, when a process accesses an invalid memory address or executes an invalid instruction, the kernel sends a SIGSEGV signal to the process. |
| -1 | SI_QUEUE | The sigqueue() function. | A signal sent from sigqueue(), with an additional integer value and a pointer can be carried. It is usually used for advanced communication between processes, such as transferring data or notifying a process that an event occurs. |
| -2 | SI_TIMER | Timer. | A signal sent from a timer for executing scheduled tasks or periodic tasks. For example, when a timer expires, the kernel sends a SIGALRM signal to the process. |
| -3 | SI_MESGQ | Message queue. | A signal sent from a message queue for inter-process communication. For example, when a process sends a message to a message queue, the kernel sends a SIGIO signal to the receiving process. |
| -4 | SI_ASYNCIO | Asynchronous I/O. | A signal sent from an asynchronous I/O operation for non-blocking I/O operations. For example, when an I/O operation on a file descriptor is complete, the kernel sends a SIGIO signal to the process. |
| -5 | SI_SIGIO | Synchronous I/O. | A signal sent from a synchronous I/O operation for non-blocking I/O operations. For example, when an I/O operation on a file descriptor is complete, the kernel sends a SIGIO signal to the process. |
| -6 | SI_TKILL | The tkill() function. | A signal sent from the function tkill(), which is similar to the function kill(). Moreover, you can specify the ID of the thread that sends the signal using tkill(). It is usually used to send a signal to a specified thread in a multithreaded program. |
Crash Logs
The text on the right of <- is not the crash log content but the description of the log format.
Common Faults
Generated by HiviewDFX@OpenHarmony
================================================================
Device info:OpenHarmony 3.2   <- Device information
Build info:OpenHarmony 5.1.0.101 <- Version information
Fingerprint:a27608aa3ce72b14c242ff04332a122b7bb629b85771a051f25fb1af8c90b613 <- Fault identification
Module name:crasher_cpp <- Module name
Timestamp:2017-08-06 21:52:51.000 <- Fault occurrence timestamp
Pid:10208 <- Process ID
Uid:0     <- User ID
Process name:./crasher_cpp <- Process name
Process life time:1s  <- Process life time
Process Memory(kB): 11902(Rss)     <- Memory used by the process
Device Memory(kB): Total 1935820, Free 516244, Available 1205608 <- Device memory status (optional)
Reason:Signal:SIGSEGV(SI_TKILL)@0x000027e0 from:10208:0 <- Fault cause. For details, see the signal value description.
Fault thread info:
Tid:10208, Name:crasher_cpp  <- ID and name of the faulty thread
#00 pc 000e8400 /system/lib/ld-musl-arm.so.1(raise+176)(a40044d0acb68107cfc4adb5049c0725) <- Call stack. The call sequence is #06->#05->...->#00, and the crash occurs in the functions of #00.
#01 pc 00006e95 /data/crasher_cpp(DfxCrasher::RaiseSegmentFaultException()+92)(d6cead5be17c9bb7eee2a9b4df4b7626)
#02 pc 00008909 /data/crasher_cpp(DfxCrasher::ParseAndDoCrash(char const*) const+612)(d6cead5be17c9bb7eee2a9b4df4b7626)
#03 pc 00008bed /data/crasher_cpp(main+104)(d6cead5be17c9bb7eee2a9b4df4b7626)
#04 pc 00073370 /system/lib/ld-musl-arm.so.1(libc_start_main_stage2+72)(a40044d0acb68107cfc4adb5049c0725)
#05 pc 00005ad8 /data/crasher_cpp(_start_c+84)(d6cead5be17c9bb7eee2a9b4df4b7626)
#06 pc 00005a7c /data/crasher_cpp(d6cead5be17c9bb7eee2a9b4df4b7626)
Registers:  <- Fault registers
r0:00000000 r1:ffc09854 r2:00000000 r3:00000008
r4:00000000 r5:fffff000 r6:0000000a r7:000000af
r8:ffc09919 r9:ffc09930 r10:00000000
fp:ffc098e8 ip:005b76e4 sp:ffc09850 lr:005ade99 pc:f7bb0400
cpsr:20870010           <-  Value of status register (cpsr for the ARM32 architecture and pstate and esr for the AArch64 architecture)
Memory near registers:  <-  Memory values near the address (which must be in valid memory) of the register at the fault site. The content in the brackets indicates the memory segment where the address in the register is located.
r1([stack]):          <- Memory value near the address of the r1 register at the fault site
    ffc0984c f7bd8348
    ffc09850 7467a186
    ffc09854 00000000
    ffc09858 00000000
    ...
r8([stack]):
    ffc09910 005b51b8
    ffc09914 ffc09964
    ffc09918 4749530e
    ffc0991c 56474553
    ffc09920 00000000
    ...
r9([stack]):
    ffc09928 005b51a4
    ffc0992c 00000000
    ffc09930 005b51f0
    ffc09934 f7756e08
    ...
fp([stack]):
    ffc098e0 0000000a
    ffc098e4 ffc09919
    ffc098e8 005b51a4
    ffc098ec 005ade99
    ...
r12(/data/crasher_cpp):
    005b76dc f76ee7f4
    005b76e0 f76ee7dc
    005b76e4 f7bb0350
    005b76e8 f75c83e5
    ...
sp([stack]):
    ffc09848 ffc09870
    ffc0984c f7bd8348
    ffc09850 7467a186
    ffc09854 00000000
    ...
lr(/data/crasher_cpp):
    005ade90 200befc0
    005ade94 ed8cf005
    005ade98 49099801
    005ade9c 68094479
    ...
pc(/system/lib/ld-musl-arm.so.1):
    f7bb03f8 e3a03008
    f7bb03fc ef000000
    f7bb0400 e51b0014
    f7bb0404 e59f1024
    ...
FaultStack: <- Stack of the crashed thread
    ffc09810 00000001
    ffc09814 00000001
    ...
sp0:ffc09850 7467a186 <- #00 stack
    ffc09854 00000000
    ...
sp1:ffc098f0 f7756e08
    ffc098f4 7467a186
    ...
sp2:ffc09908 00000000
    ffc0990c 005b51f0
    ...
sp3:ffc099f0 ffc09a44
    ffc099f4 7467a186
    ...
    ffc09a00 005afb85
    ffc09a04 f7b3b374
    ffc09a08 ffc09a44
    ffc09a0c 00000000
    ffc09a10 00000000
    ffc09a14 f7aeec24
    ffc09a18 ffc09a38
    ffc09a1c 005acadc
    ffc09a20 005b38d0
    ffc09a24 00000000
    ffc09a28 00000000
    ffc09a2c ffc09a44
    ffc09a30 00000002
    ffc09a34 ffc09a40
    ffc09a38 00000000
    ffc09a3c 005aca80
sp5:ffc09a40 00000002
    ffc09a44 ffc09e25
    ...

Maps: <- Memory space of the process when the fault occurs
5a7000-5ac000 r--p 00000000 /data/crasher_cpp
5ac000-5b5000 r-xp 00004000 /data/crasher_cpp
5b5000-5b8000 r--p 0000c000 /data/crasher_cpp
5b8000-5b9000 rw-p 0000e000 /data/crasher_cpp
2290000-2291000 ---p 00000000 [heap]
2291000-2293000 rw-p 00000000 [heap]
...
f7ac4000-f7ac5000 r-xp 00000000 [sigpage]
f7ac5000-f7ac7000 r--p 00000000 [vvar]
f7ac7000-f7ac8000 r-xp 00000000 [vdso]
f7ac8000-f7b22000 r--p 00000000 /system/lib/ld-musl-arm.so.1
f7b22000-f7bec000 r-xp 00059000 /system/lib/ld-musl-arm.so.1
f7bec000-f7bee000 r--p 00122000 /system/lib/ld-musl-arm.so.1
f7bee000-f7bf0000 rw-p 00123000 /system/lib/ld-musl-arm.so.1
f7bf0000-f7c00000 rw-p 00000000 [anon:ld-musl-arm.so.1.bss]
ffbe9000-ffc0a000 rw-p 00000000 [stack]
ffff0000-ffff1000 r-xp 00000000 [vectors]
OpenFiles: <- Information about the file handles held by the process when the fault occurs
0->/dev/pts/0 native object of unknown type 0
1->/dev/pts/0 native object of unknown type 0
2->/dev/pts/0 native object of unknown type 0
3->socket:[102975] native object of unknown type 0
9->socket:[13080] native object of unknown type 0
14->/dev/console native object of unknown type 0

HiLog: <- HiLog logs of the process before the fault occurs
08-06 21:52:51.212 10208 10208 E C03f00/MUSL-SIGCHAIN: signal_chain_handler call 2 rd sigchain action for signal: 11 sca_sigaction=f7b3e638 noreturn=0 FREEZE_signo_11 thread_list_lock_status:-1 tl_lock_count=0 tl_lock_waiters=0 tl_lock_tid_fail=-1 tl_lock_count_tid=-1 tl_lock_count_fail=-10000 tl_lock_count_tid_sub=-1 thread_list_lock_after_lock=-1 thread_list_lock_pre_unlock=-1 thread_list_lock_pthread_exit=-1 thread_list_lock_tid_overlimit=-1 tl_lock_unlock_count=0 __pthread_gettid_np_tl_lock=0 __pthread_exit_tl_lock=0 __pthread_create_tl_lock=0 __pthread_key_delete_tl_lock=0 __synccall_tl_lock=0 __membarrier_tl_lock=0 install_new_tls_tl_lock=0 set_syscall_hooks_tl_lock=0 set_syscall_hooks_linux_tl_lock=0 fork_tl_lock=0
08-06 21:52:51.212 10208 10208 I C02d11/DfxSignalHandler: DFX_SigchainHandler :: signo(11), si_code(-6), pid(10208), tid(10208).
08-06 21:52:51.212 10208 10208 I C02d11/DfxSignalHandler: DFX_SigchainHandler :: signo(11), pid(10208), processName(./crasher_cpp),         threadName(crasher_cpp).
The following describes the content of a three-layer call stack in detail:
#00 pc 000e8400 /system/lib/ld-musl-arm.so.1(raise+176)(a40044d0acb68107cfc4adb5049c0725)
#01 pc 00006e95 /data/crasher_cpp(DfxCrasher::RaiseSegmentFaultException()+92)(d6cead5be17c9bb7eee2a9b4df4b7626)
#02 pc 00008909 /data/crasher_cpp(DfxCrasher::ParseAndDoCrash(char const*) const+612)(d6cead5be17c9bb7eee2a9b4df4b7626)
| Frame | Number of Offset Bytes of PC in the File | File Name of the Memory Segment to Which PC Belongs | Function | Number of Offset Bytes in the Function | BuildID |
|---|---|---|---|---|---|
| #00 | 000e8400 | /system/lib/ld-musl-arm.so.1 | raise | 176 | a40044d0acb68107cfc4adb5049c0725 |
| #01 | 00006e95 | /data/crasher_cpp | DfxCrasher::RaiseSegmentFaultException() | 92 | d6cead5be17c9bb7eee2a9b4df4b7626 |
| #02 | 00008909 | /data/crasher_cpp | DfxCrasher::ParseAndDoCrash(char const*) const | 612 | d6cead5be17c9bb7eee2a9b4df4b7626 |
NOTE
- The file name may also be an anonymous memory mapping, for example, [heap] or [stack].
- When the length of a function name exceeds 256 bytes, the name and number of offset bytes of the function are not recorded in C++ crash logs.
- If BuildID is not displayed, run the readelf -n xxx.so command to check whether the binary file contains BuildID. If not, add the compilation parameter –enable-linker-build-id and do not add –build-id=none to LDFLAGS.
Null Pointer Dereferences
Null pointer dereference often occurs in the following scenarios:
When a crash is in format of SIGSEGV(SEGV_MAPERR)@0x00000000 or the values of the registers such as r0 and r1 in the Register field are 0, a null pointer may be passed in when the function is called.
When a crash is in format of SIGSEGV(SEGV_MAPERR)@0x0000000c (smaller than the size of a memory page) or the value of the registers such as r1 in the Register field is small, a null pointer may be passed in when the struct member of the input parameter is called.
In this scenario, a message is printed in the log, indicating that the fault may be caused by a null pointer dereference. The following is an example process crash log archived by DevEco Studio in FaultLog:
Generated by HiviewDFX@OpenHarmony
================================================================
Device info:OpenHarmony 3.2        <- Device information
Build info:OpenHarmony 5.0.0.23    <- Build information
Fingerprint:cdf52fd0cc328fc432459928f3ed8edfe8a72a92ee7316445143bed179138073 <- Fingerprint
Module name:crasher_cpp            <- Module name
Timestamp:2024-05-06 20:10:51.000  <- Timestamp when the fault occurs
Pid:9623   <- Process ID
Uid:0         <- User ID
Process name:./crasher_cpp         <- Process name
Process life time:1s               <- Process life time
Process Memory(kB): 11902(Rss)     <- Memory used by the process
Device Memory(kB): Total 1935820, Free 516244, Available 1205608 <- Device memory status (optional)
Reason:Signal:SIGSEGV(SEGV_MAPERR)@0x00000004 probably caused by NULL pointer dereference  <- Fault cause and null pointer prompt
Fault thread info:
Tid:9623, Name:crasher_cpp         <- Thread ID, thread name
#00 pc 00008d22 /system/bin/crasher_cpp(TestNullPointerDereferenceCrash0()+22)(adfc673300571d2da1e47d1d12f48b44)  <- Call stack
#01 pc 000064d1 /system/bin/crasher_cpp(DfxCrasher::ParseAndDoCrash(char const*) const+160)(adfc673300571d2da1e47d1d12f48b44)
#02 pc 00006569 /system/bin/crasher_cpp(main+92)(adfc673300571d2da1e47d1d12f48b44)
#03 pc 00072b98 /system/lib/ld-musl-arm.so.1(libc_start_main_stage2+56)(d820b1827e57855d4f9ed03ba5dfea83)
#04 pc 00004e28 /system/bin/crasher_cpp(_start_c+84)(adfc673300571d2da1e47d1d12f48b44)
#05 pc 00004dcc /system/bin/crasher_cpp(adfc673300571d2da1e47d1d12f48b44)
Registers:   <- Fault registers
r0:ffffafd2 r1:00000004 r2:00000001 r3:00000000
r4:ffd27e39 r5:0096e000 r6:00000a40 r7:0096fdfc
r8:f7ba58d5 r9:f7baea86 r10:f7cadd38
fp:ffd27308 ip:f7cb2078 sp:ffd272a0 lr:f7c7ab98 pc:0096ad22
cpsr:20870010           <-  Value of status register (cpsr for the ARM32 architecture and pstate and esr for the AArch64 architecture)
...
Stack Overflows
Stack overflow is likely to occur in the following scenarios:
- The stack memory is used up because the recursive termination condition is not set during recursive call.
- The stack memory is used up because local variables occupy too much stack memory.
- The stack memory used in the signal stack exceeds the system limit.
static void *DoStackOverflow(void * inputArg)
{
    int b[10] = {1};
    int *c = nullptr;
    (void)memcpy_s(c, sizeof(int), b, sizeof(int));
    if (b[0] == 0) {
        return static_cast<void*>(b + 9); // 9: last element of array
    }
    DoStackOverflow(inputArg);
    return static_cast<void*>(b + 9); // 9: last element of array
}
DoStackOverflow is called recursively for multiple times. As a result, the memory is read and written outside the stack after the stack memory is used up, and a crash occurs.
In this scenario, a message is recorded in the log, indicating that the fault may be caused by stack overflow. The following is an example process crash log archived by DevEco Studio in FaultLog:
Generated by HiviewDFX@OpenHarmony
================================================================
Device info:OpenHarmony 3.2            <- Device information
Build info:OpenHarmony 5.0.0.23        <- Build information
Fingerprint:8bc3343f50024204e258b8dce86f41f8fcc50c4d25d56b24e71fe26c0a23e321  <- Fingerprint
Module name:crasher_cpp                <- Module name
Timestamp:2024-05-06 20:18:24.000      <- Timestamp when the fault occurs
Pid:9838                               <- Process ID
Uid:0                                  <- User ID
Process name:./crasher_cpp             <- Process name
Process life time:2s                   <- Process life time
Process Memory(kB): 11902(Rss)     <- Memory used by the process
Device Memory(kB): Total 1935820, Free 516244, Available 1205608 <- Device memory status (optional)
Reason:Signal:SIGSEGV(SEGV_ACCERR)@0xf76b7ffc current thread stack low address = 0xf76b8000, probably caused by stack-buffer-overflow <- Fault cause and stack overflow prompt
Tid:10343, Name:crasher_cpp
#00 pc 000072e6 /data/crasher_cpp(DoStackOverflow(void*)+30)(d6cead5be17c9bb7eee2a9b4df4b7626)
#01 pc 00007305 /data/crasher_cpp(DoStackOverflow(void*)+60)(d6cead5be17c9bb7eee2a9b4df4b7626)
#02 pc 00007305 /data/crasher_cpp(DoStackOverflow(void*)+60)(d6cead5be17c9bb7eee2a9b4df4b7626)
#03 pc 00007305 /data/crasher_cpp(DoStackOverflow(void*)+60)(d6cead5be17c9bb7eee2a9b4df4b7626)
#04 pc 00007305 /data/crasher_cpp(DoStackOverflow(void*)+60)(d6cead5be17c9bb7eee2a9b4df4b7626)
#05 pc 00007305 /data/crasher_cpp(DoStackOverflow(void*)+60)(d6cead5be17c9bb7eee2a9b4df4b7626)
...
Stack Corruptions
Stack corruptions occur when the stack memory that stores function call information is overwritten during service code running. As a result, the call stack cannot be traced. In this scenario, the system displays a message in the log, indicating that you need to parse the unreliable call stack in the thread stack memory from #xx.
An unreliable call stack indicates an incomplete call chain. That is, two adjacent stacks starting from the #xx layer may have no call relationship. Therefore, you need to analyze the call chain based on the service code. In the following example, the correct call sequence is #05->#04->#03->#01. The following is an example process crash log archived by DevEco Studio in FaultLog:
Generated by HiviewDFX@OpenHarmony
================================================================
Device info:OpenHarmony 3.2               <- Device information
Build info:OpenHarmony 5.0.0.23           <- Build information
Fingerprint:79b6d47b87495edf27135a83dda8b1b4f9b13d37bda2560d43f2cf65358cd528    <- Fingerprint
Module name:crasher_cpp                   <- Module name
Timestamp:2024-05-06 20:27:23.2035266415  <- Timestamp when the fault occurs
Pid:10026                                 <- Process ID
Uid:0                                     <- User ID
Process name:./crasher_cpp                <- Process name
Process life time:1s                      <- Process life time
Process Memory(kB): 11902(Rss)            <- Memory used by the process
Device Memory(kB): Total 1935820, Free 516244, Available 1205608 <- Device memory status (optional)
Reason:Signal:SIGSEGV(SEGV_MAPERR)@0000000000 probably caused by NULL pointer dereference  <- Fault cause
LastFatalMessage:Failed to unwind stack, try to get unreliable call stack from #02 by reparsing thread stack <- #00 and #01 are generally considered reliable. You need to parse unreliable call stacks in the thread stack memory from #02.
Fault thread info:
Tid:10026, Name:crasher_cpp               <- Thread ID, thread name
#00 pc 00000000 Not mapped
#01 pc 0002bcdb /system/lib/chipset-pub-sdk/libutils.z.so(memset_s+24)(15f72d32d228b22e72a13b438c75599d)
#02 pc 000f14a8 /system/lib/ld-musl-arm.so.1(printf+72)(a40044d0acb68107cfc4adb5049c0725)
#03 pc 00006d3b /data/crasher_cpp(RecursiveHelperFunction(int, int, int)+54)(d6cead5be17c9bb7eee2a9b4df4b7626)
#04 pc 00006d5b /data/crasher_cpp(RecursiveHelperFunction(int, int, int)+86)(d6cead5be17c9bb7eee2a9b4df4b7626)
#05 pc 00006d5b /data/crasher_cpp(RecursiveHelperFunction(int, int, int)+86)(d6cead5be17c9bb7eee2a9b4df4b7626)
...
Registers:
r0:00000000 r1:c2085db0 r2:00000000 r3:ff8970c8
r4:0000003f r5:00000000 r6:f755c0e0 r7:00000000
r8:ff8975c9 r9:ff8975e0 r10:00000001
fp:008de1a4 ip:f76b5c48 sp:ff896fd0 lr:f76abcdf pc:00000000
cpsr:20870010
...
Asynchronous Thread Call Stack Tracing Faults
When an asynchronous thread crashes, the stack of the thread that submits the asynchronous task is also displayed to help locate the crash. Currently, the ARM64 architecture is supported on the debug application (HAP_DEBUGGABLE). The call stack of the crash thread and that of the submission thread are separated by SubmitterStacktrace. The following is an example process crash log archived by DevEco Studio in FaultLog:
Generated by HiviewDFX@OpenHarmony
================================================================
Device info:OpenHarmony 3.2                 <- Device information
Build info:OpenHarmony 5.0.0.23             <- Build information
Fingerprint:8bc3343f50024204e258b8dce86f41f8fcc50c4d25d56b24e71fe26c0a23e321  <- Fingerprint
Module name:crasher_cpp                     <- Module name
Timestamp:2024-05-06 20:28:24.000           <- Timestamp when the fault occurs
Pid:9838                                    <- Process ID
Uid:0                                       <- User ID
Process name:./crasher_cpp                  <- Process name
Process life time:2s                        <- Process life time
Process Memory(kB): 11902(Rss)            <- Memory used by the process
Device Memory(kB): Total 1935820, Free 516244, Available 1205608 <- Device memory status (optional)
Reason:Signal:SIGSEGV(SI_TKILL)@0x000000000004750 from:18256:0   <- Fault Cause
Fault thread info:
Tid:18257, Name:crasher_cpp                 <- Thread ID, thread name
#00 pc 000054e6 /system/bin/ld-musl-aarch64.so.l(raise+228)(adfc673300571d2da1e47d1d12f48b44) <- Call stack
#01 pc 000054f9 /system/bin/crasher_cpp(CrashInSubThread(void*)+56)(adfc673300571d2da1e47d1d12f48b50)
#02 pc 000054f9 /system/bin/ld-musl-aarch64.so.l(start+236)(adfc673300571d2da1e47d1d12f48b44)
========SubmitterStacktrace========       <- The call stack used to print submitting thread
#00 pc 000094dc /system/bin/crasher_cpp(DfxCrasher::AsyncStacktrace()+36)(adfc673300571d2da1e47d1d12f48b50)
#01 pc 00009a58 /system/bin/crasher_cpp(DfxCrasher::ParseAndDoCrash(char const*) const+232)(adfc673300571d2da1e47d1d12f48b50)
#02 pc 00009b40 /system/bin/crasher_cpp(main+140)(adfc673300571d2da1e47d1d12f48b50)
#03 pc 0000a4e1c /system/bin/ld-musl-aarch64.so.l(libc_start_main_stage2+68)(adfc673300571d2da1e47d1d12f48b44)
...
Reading Assembly Instructions
Using llvm-objdump
llvm-objdump is a disassembler provided by the system. It is archived in [SDK DIR PATH]/default/openharmony/native/llvm/bin/llvm-objdump.exe. You can run the following command to use it:
llvm-objdump.exe -d -l libark_jsruntime.so > dump.txt
This command is used to export the full assembly instructions of libark_jsruntime.so to the dump.txt file.
Cases
The core C ++ crash logs are as follows:
Process name:com.ohos.medialibrary.medialibrarydata
Process life time:13402s
Process Memory(kB): 11902(Rss)
Device Memory(kB): Total 1935820, Free 516244, Available 1205608
Reason:SIGSEGV(SEGV_MAPERR)@0x0000005b3b46c000
Fault thread info:
Tid:48552, Name:UpradeTask
#00 pc 00000000000a87e4 /system/lib/ld-musl-aarch64.so.1(memcpy+356)(3c3e7fb27680dc2ee99aa08dd0f81e85)
...
Analysis procedure:
Based on the PC register address, find the corresponding assembly instruction and determine the instruction that crashes when it is executed.
In the C++ crash log file, find the PC address at the stack top and disassemble the corresponding binary codes. For example, if a crash occurs when the instruction corresponding to the address 00000000000a87e4 is executed, disassemble the 0xa87e4 offset address in the ld-musl-aarch64.so.1 file to display the instruction information.
xxx/../../third_party/optimized-routines/string/aarch64/memcpy.S:175 <- Line number of the source code
a87e4:   a94371aa         ldp x10, x11, [x1, #48]
Address:    Value                   Assembly instruction
ldp indicates an LDP instruction, which is used to load two 64-bit data from the memory to two different registers at the same time.
ldp    x10,        x11,    [x1, #48]
LDP Target register 1 Target register 2 <source address>
This instruction reads two consecutive 64-bit data from the specified position (determined by the address in register x1 plus a 48-byte offset) in the memory and store the data to registers x10 and x11.
Check the code of the memcpy.S source file corresponding to line 175:
L(loop64):
line 170   stp A_l, A_h, [dst, 16]
line 171   ldp A_l, A_h, [src, 16]
line 172   stp B_l, B_h, [dst, 32]
line 173   ldp B_l, B_h, [src, 32]
line 174   stp C_l, C_h, [dst, 48]
line 175   ldp C_l, C_h, [src, 48]      <-  The crash instruction
line 176   stp D_l, D_h, [dst, 64]
line 177   ldp D_l, D_h, [src, 64]
line 178   subs count, count, 64
line 179   b.hi L(loop64)
Based on the register value and context, determine which object causes the fault.
For a non-class member function, the x0 register loads the first parameter of the function, x1 loads the second parameter, x2 loads the third parameter, and so on. For a class member function, x0 loads the pointer to the class instance object, and x1, x2, and x3 load parameters. Note that if the number of function parameters exceeds 5, the parameters are pushed into the stack. For the parameters of void* memcpy(void* restrict dest, void* restrict src, size_t n) in the stack top, x0 loads dest (destination address), x1 loads src (source address), and x2 loads n (number of copied bytes).
Register:
x0:000005b50c3e3c4 x1:000005b3b46bfcc x2:0000000000007e88 x3:000005b50c42380
...
Based on the three register values in C++ crash logs and the crash address 0x0000005b3b46c000, it is determined that the faulty parameter is the second parameter (source address) of the memcpy function.
Determine the fault type based on the memory features near the crash address.
Check Memory near registers in the C++ crash logs:
x1(xxxx):
    0000005b3b46bf84 8067d0f2e727f00a
    0000005b3b46bf8c 1b10e1e9a1079f7a
    0000005b3b46bf94 83906d9c18cdb9c1
    0000005b3b46bf9c 627dd75ab9335eb0
    0000005b3b46bfa4 aabe2bb1b00f2c03
    0000005b3b46bfac f981e4acb716cbc1
    0000005b3b46bfb4 806b3d5730d281ee
    0000005b3b46bfbc 3e99fedbc0a9b5e9
    0000005b3b46bfc4 a91ab9d327969682
    0000005b3b46bfcc ffffffffffffffff       -----> Out-of-bounds read
    0000005b21bb2008 ffffffffffffffff
    0000005b21bb2010 ffffffffffffffff
    0000005b21bb2018 ffffffffffffffff
    0000005b21bb2020 ffffffffffffffff
    0000005b21bb2028 ffffffffffffffff
    0000005b21bb2030 ffffffffffffffff
According to the log, an out-of-bound read problem occurs. You only need to analyze the input parameters src (pointer to the source memory) and n (number of copied bytes) of memcpy.
Track the parameter source of the problematic object and locate the problem based on the code and HiLog logs.
Check whether the parameter object is valid and whether the value range is valid. For example, check whether the size of the source memory is the same as the value of n.
Check whether the lifecycle of the parameter object is valid. For example, check whether the source memory has been released and whether there are multi-thread operation objects.
Check the improper operation logic of parameters based on the function context. For example, trace the operation logic of buf and bufsize, add debugging information, and locate the improper operation logic. The context segment is as follows:
static StatusInter xxxFunc(const uint8_t *buf, uint32_t bufSize)
{
// ...
uint32_t srcSize = bufSize;
uint32_t srcOffset = cache->appendOffset - bufSize;
errno_t ret = memcpy_s(cache->buffer + srcOffset, srcSize, buf, bufSize);
if (ret != EOK) {
    return MEMORY_OPERATE_FAILED_INTER;
}
// ...
}
By continuously tracing the sources of buf and bufSize, it is found that the value of bufSize is greater than that of buf after continuous copy. As a result, an out-of-bounds read problem occurs.
你可能感兴趣的鸿蒙文章
harmony 鸿蒙Performance Analysis Kit
harmony 鸿蒙Analyzing Application Freeze
harmony 鸿蒙Development of Application Recovery
harmony 鸿蒙Development of Error Manager
harmony 鸿蒙Introduction to HiAppEvent
harmony 鸿蒙Subscribing to Address Sanitizer Events (ArkTS)
- 所属分类: 后端技术
- 本文标签:
热门推荐
-
2、 优质文章
-
3、 gt
-
7、 openharmony
-
9、 golang
-
10、 Vue中input框自动聚焦