harmony 鸿蒙Main Thread Jank Event Overview
Main Thread Jank Event Overview
Introduction
When the main thread of an application executes a time-consuming task, the user perceives the application freezing. However, if the freezing duration does not reach the freezing time limit, no error will be logged, which is inconvenient for you to locate the fault. To address this problem, the system provides a mechanism for detecting the task execution timeout in the main thread, which generates call stack sampling files or trace files for you to locate and analyze the task execution status of the main thread.
You can use the hiAppEvent APIs to subscribe to the main thread jank event to obtain the debugging and maintenance information.
Default Main Thread Jank Event Time Specifications
When the main thread experiences a timeout between 150 ms and 450 ms, it triggers a call stack sampling. If the timeout exceeds 450 ms, it triggers a trace sampling.
Begin time.
Stack sampling triggered by main thread Jank (150 ms < Main thread processing time < 450 ms): For the processes with the same PID, the call stack sampling for a main thread jank event can be triggered only once. If Developer Options is enabled, call stack sampling can be triggered once an hour. No timeout check is performed within 10s after the application starts.
Trace sampling triggered by main thread jank (Main thread processing time > 450 ms): For the processes with the same PID, the trace sampling for a main thread jank event can be triggered only once in a day.
NOTE
To enable the main thread checker to collect tracing data when a task times out, ensure that the nolog version is used and Developer Options is disabled
You can go to Settings > About phone to check the software version. The log version ends with log.
When Developer Options is disabled, DevEco Studio may be unavailable. Therefore, you are advised to install the application before disabling Developer Options.
Stack capture time.
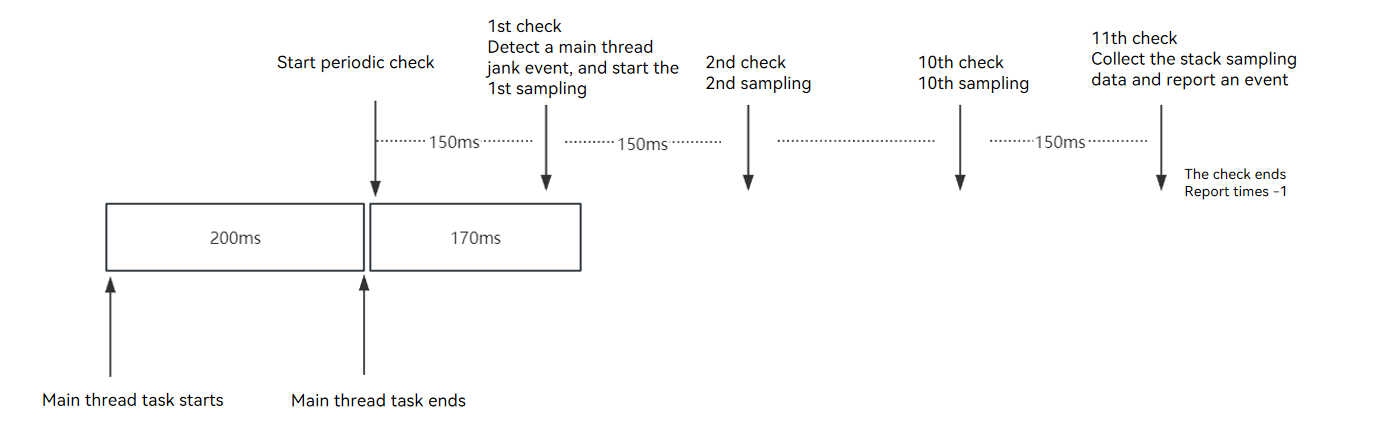
When the main thread jank event occurs, the main thread checker starts to check whether the jank event occurs again every 150 ms (1 ≤ number of check times ≤ 2). There are three cases:
(1) If a jank event is detected during the first check, the main thread checker starts stack sampling every 150 ms for 10 times. The stack sampling data is collected and an event is reported at the next interval. Then the check ends.
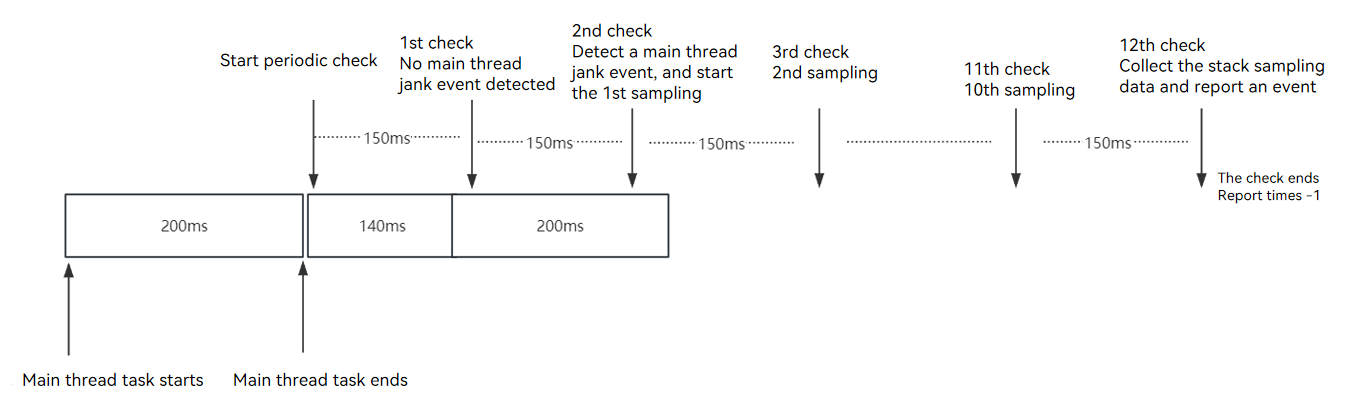
(2) If a jank event is detected during the second check, the main thread checker starts stack sampling every 150 ms for 10 times. The stack sampling data is collected and an event is reported at the next interval. Then the check ends.
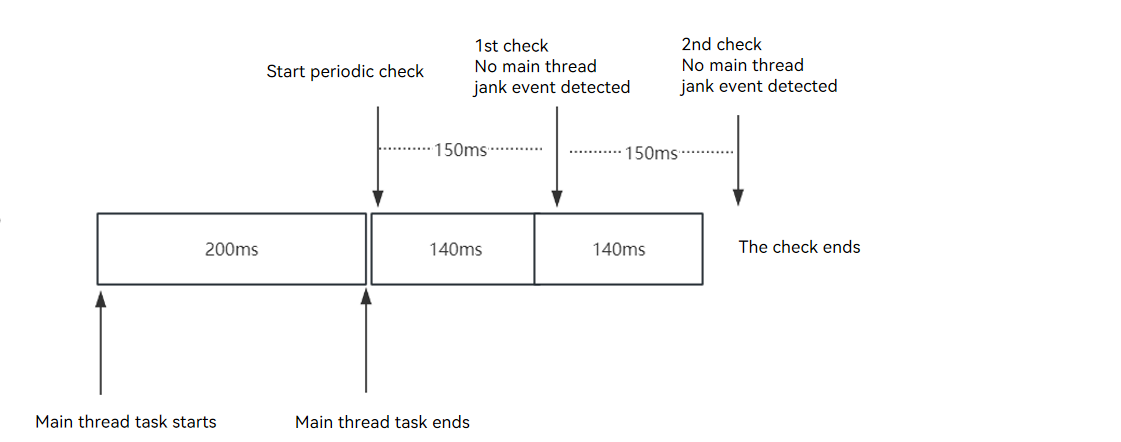
(3) If no jank event is detected in the two checks, the check ends.
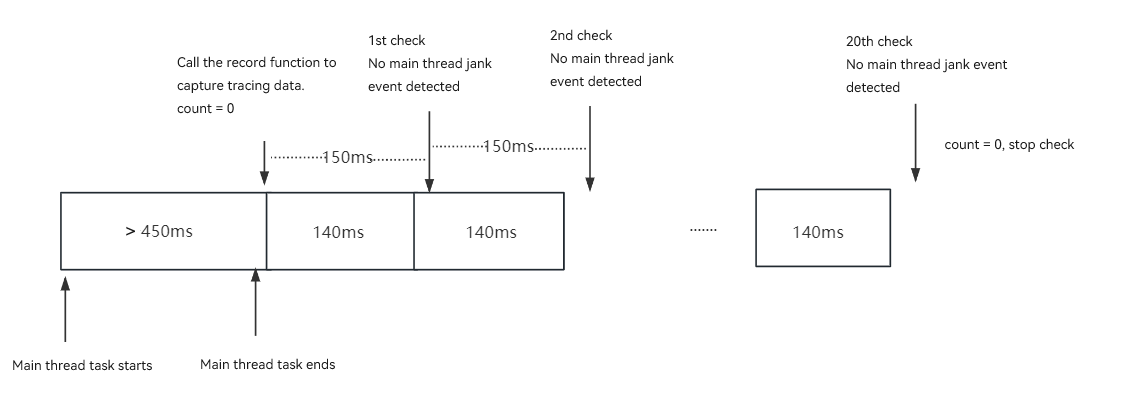
Trace capture time.
After the function is called to capture tracing data, the main thread checker checks for a main thread jank event every 150 ms for 20 times. If a main thread jank event occurs in any of the 20 checks, the check ends in 3s and the tracing data is stored.
(1) No main thread jank event is detected.
(2) At least one main thread jank event is detected.

Customizing Stack Sampling Parameters
The system provides the basic check function for the main thread jank event. However, if your application has special requirements for the check interval and collection times, you can customize parameters for stack sampling.
For details about how to use the APIs, see hiAppEvent.setEventConfig in Application Event Logging.
Available APIs
| API | Description |
|---|---|
| setEventConfig(name: string, config: Record |
Sets the parameters of the main thread jank event that triggers the stack sampling. The value of name is MAIN_THREAD_JANK. |
Setting Parameters
You can use the API provided by HiAppEvent to customize the parameters for collecting the MAIN_THREAD_JANK event in Record
You can customize the specifications of the MAIN_THREAD_JANK event by setting the value of log_type (log collecting type of the MAIN_THREAD_JANK event). The specifications are as follows:
If log_type is set to the default value 0, the stack sampling is triggered when the main thread processing time is greater than 150 ms but less than 450 ms, and the trace sampling is triggered when the main thread processing time exceeds 450 ms. If log_type has been set to 1 for capturing stack sampling data, the custom parameter is invalid. The setting example is as follows:
    let params: Record<string, hiAppEvent.ParamType> = {
    "log_type": "0"
    };
If log_type is set to 1, you can customize the threshold parameters of the main thread jank event for triggering the stack sampling. You must set the following parameters:
(1) sample_interval: sampling interval of the main thread jank event. The system performs the check based on the custom interval and uses the interval for the periodic check. The value range is [50, 500], in ms. The default value is 150 ms.
(2) ignore_startup_time: time window after thread startup during which no checks are performed. For the process that takes time to start, it is not necessary to capture the full stack. You can set this parameter to prevent the check from being performed within the custom startup time. The minimum value is 3s. The default value is 10s.
(3) sample_count: number of sampling times for the main thread jank event. After detecting that the main thread processing time exceeds the threshold, the system starts periodic stack sampling for sample_count times. The minimum value is 1. The maximum value can be calculated based on the custom value of sample_interval as follows:
sample_count ≤ (2500/sample_interval - 4) You need to set the parameters as required.NOTE
The value 2500 (ms) indicates the maximum time allowed for a main thread jank event to be reported after being detected. Therefore, the value of sample_count cannot be greater than the maximum value calculated based on the formula.
The value 4 indicates the number of check intervals, that is, the first check interval, the twice second check intervals, and the interval for collecting and reporting stack information.
(4) report_times_per_app: number of sampling reporting times for the main thread jank event of the processes with the same PID of an application. This parameter can be set only once for the processes with the same PID.
NOTE
When Developer Options is enabled, the value range is [1, 3] times per hour. The default value is 1.
When Developer Options is disabled, the value range is [1, 3] times per day. The default value is 1.
The setting example is as follows:
    let params: Record<string, hiAppEvent.ParamType> = {
    "log_type": "1",
    "sample_interval": "100",
    "ignore_startup_time": "11",
    "sample_count": "21",
    "report_times_per_app": "3"
    };
If log_type is set to 2, a trace sampling is triggered when the main thread processing time exceeds 450 ms. The setting example is as follows:
    let params: Record<string, hiAppEvent.ParamType> = {
    "log_type": "2"
    };
Log Specifications of the Main Thread Jank Event
Log aging.
Generally, the size of a stack file is 7 KB to 10 KB, and the size of a trace file is 1 MB to 5 MB. The watchdog directory in the app sandbox can store a maximum of 10 MB files. If the total file size exceeds 10 MB, the user needs to manually delete files. The path to watchdog is /data/storage/el2/log/watchdog/.
You can obtain the log path from external_logs.
Currently, stack capturing supports only the ARM64 architecture. The stack capture result contains both native frames and JS frames parsed.
An example of the stack capture result is as follows:
```text
9 #00 pc 0000757c /system/bin/appspawn(55679d09bcdea35bb1e0d4e1d9a3e58f)
    9 #01 pc 000731c0 /system/lib/ld-musl-aarch64.so.1(add9e521e4eaf5cb009d4260f3b69ccd)
        9 #02 pc 000090a9 /system/bin/appspawn(main+396)(55679d09bcdea35bb1e0d4e1d9a3e58f)
            9 #03 pc 0000ab5d /system/bin/appspawn(AppSpawnRun+100)(55679d09bcdea35bb1e0d4e1d9a3e58f)
                9 #04 pc 0000e7f1 /system/lib/chipset-pub-sdk/libbegetutil.z.so(RunLoop_+200)(52ace27d827ad482439bf32cc75bb17b)
                ......
                                        9 #21 pc 00107aec /system/lib/ld-musl-aarch64.so.1(__pthread_cond_timedwait+628)(add9e521e4eaf5cb009d4260f3b69ccd)
1 #00 pc 00032e67 /system/lib/platformsdk/libmmi-util.z.so(OHOS::MMI::UDSSocket::OnReadPackets(OHOS::MMI::CircleStreamBuffer&, std::__h::function<void (OHOS::MMI::NetPacket&)>)+158)(99e56bc765f9208f7b7ba8b268886a59)
    1 #01 pc 0000312e5 /system/lib/platformsdk/libmmi-client.z.so(OHOS::MMI::ClientMsgHandler::OnMsgHandler(OHOS::MMI::UDSClient const&, OHOS::MMI::NetPacket&)+340)(66ac85e964777ae89f0c26c339093cd1)
        1 #02 pc 0003016b /system/lib/platformsdk/libmmi-client.z.so(OHOS::MMI::ClientMsgHandler::OnPointerEvent(OHOS::MMI::UDSClient const&, OHOS::MMI::NetPacket&)+1222)(66ac85e964777ae89f0c26c339093cd1)
            1 #03 pc 0003b96b /system/lib/platformsdk/libmmi-client.z.so(OHOS::MMI::InputManagerImpl::OnPointerEvent(std::__h::shared_ptr<OHOS::MMI::PointerEvent>)+1370)(66ac85e964777ae89f0c26c339093cd1)
                1 #04 pc 00095903 /system/lib/platformsdk/libwm.z.so(OHOS::Rosen::InputEventListener::OnInputEvent(std::__h::shared_ptr<OHOS::MMI::PointerEvent>) const+478)(9c40c5f416d6f830435126998fbcad42)
                ......
                                        1 #21 pc 003f5c55 /system/lib/platformsdk/libark_jsruntime.so(4e6a2651ec80a7f639233f414d6486fe)
                                            1 #22 at anonymous (/entry/build/default/cache/default/default@CompileArkTS/esmodule/debug/entry/src/main/ets/pages/Index.js:67:17)
                                                1 #23 at wait2 (/entry/build/default/cache/default/default@CompileArkTS/esmodule/debug/entry/src/main/ets/pages/Index.js:16:12)
                                                ......
```
Each stack capture records 16 KB call stack information of the main thread for stack unwinding. Therefore, each stack capture result contains a maximum of 16 KB invocation information of the process for 10 times. The captured data is displayed in a tree view, with repeated stack frames aggregated and different call layers distinguished by line indentation. If the stack fails to be captured (for example, the main thread is blocked in the kernel or signals are masked), the content of the /proc/self/wchan file is output.
In the result, each row indicates a piece of stack information. The meaning of a row of stack frame information can be interpreted as follows:
Native frame:
```text
9 #02 pc 000090a9 /system/bin/appspawn(main+396)(55679d09bcdea35bb1e0d4e1d9a3e58f)
^  ^       ^               ^              ^                   ^
1  2       3               4              5                   6

1 indicates the number of times that the frame is sampled.
2 indicates the invoking level of the frame. The line indentation size corresponds to this level. The number of sampling times of all frames at the same level cannot be greater than 10. The number of sampling times of #00 is 10 (set the sampling times).
3 indicates the Program Counter (PC) value of the native frame.
4 indicates the path of the called file.
5 indicates the name of the called function and code line offset (available in unstripped version, and may not available in stripped version).
6 indicates the MD5 value of the .so file.
```
JS frame:
```text
1 #23 at wait2 (/entry/build/default/cache/default/XXX/entry/src/main/ets/pages/Index.js:16:12)
^  ^    ^               ^
1  2    3               4

1 indicates the number of times that the frame is sampled. The maximum value is the sampling times.
2 indicates the invoking level of the frame, which is the same as that of the native frame.
3 indicates the name of the called function, which is **wait2**.
4 indicates the path, file, row number, and column number of the called function.
```
Trace specifications.
The size of the trace file is 1 MB to 5 MB. You can visually analyze the trace file using SmartPerf. You can download the tool from developtools_smartperf_host Release.
For details about the trace file, see Loading Trace Files on the Web Client.
params
| Name | Type | Description |
|---|---|---|
| time | number | Event triggering time, in ms. |
| bundle_version | string | Application version. |
| bundle_name | string | Application name. |
| pid | number | Process ID of the application. |
| uid | number | User ID of the application. |
| begin_time | number | Begin time of a task in the main thread. |
| end_time | number | End time of a task in the main thread. |
| external_log | string[] | Path of the generated log files. If the directory files exceed the threshold (for details, see log_over_limit), new log files may fail to be written. Therefore, delete the log files immediately after they are processed. |
| log_over_limit | boolean | Whether the size of generated log files and existing log files exceeds the upper limit (10 MB). The value true indicates that the upper limit is exceeded and logs fail to be written. The value false indicates that the upper limit is not exceeded. |
| app_start_jiffies_time | number | Start time of the task when the main thread jank event occurs. The information is printed in the sampling stack. |
| heaviest_stack | string | Call stack that is generated multiple times in the log file. The information is printed in the sampling stack. |
你可能感兴趣的鸿蒙文章
harmony 鸿蒙Performance Analysis Kit
harmony 鸿蒙Analyzing Application Freeze
harmony 鸿蒙Development of Application Recovery
harmony 鸿蒙Development of Error Manager
harmony 鸿蒙Introduction to HiAppEvent
- 所属分类: 后端技术
- 本文标签:
热门推荐
-
2、 优质文章
-
3、 gt
-
7、 openharmony
-
9、 golang
-
10、 Vue中input框自动聚焦