harmony 鸿蒙JSVM-API Debugging
JSVM-API Debugging
JavaScript virtual machine (JSVM) is a standard JavaScript (JS) code execution engine that strictly complies with the ECMAScript specification. For details, see JSVM. The JSVM-based code debugging and tuning capabilities include Debugger, CPU Profiler, Heap Snapshot, and Heap Statistics. The following APIs are involved: |API| Description| |—|—| |OH_JSVM_GetVM| Obtains a VM instance.| |OH_JSVM_GetHeapStatistics| Obtains heap statistics of a VM.| |OH_JSVM_StartCpuProfiler| Creates and starts a CPU profiler instance.| |OH_JSVM_StopCpuProfiler| Stops the CPU profiler and outputs the result to a stream.| |OH_JSVM_TakeHeapSnapshot| Obtains a snapshot of the current heap and outputs it to a stream.| |OH_JSVM_OpenInspector| Opens an inspector instance on the specified host and port for debugging JS code.| |OH_JSVM_OpenInspectorWithName|Opens an inspector instance based on the PID and name.| |OH_JSVM_CloseInspector| Closes all remaining inspector connections.| |OH_JSVM_WaitForDebugger| Waits for the host to set up a socket connection with an inspector. After the connection is set up, the application continues to run. You can use Runtime.runIfWaitingForDebugger to run paused targets.|
This topic describes how to use Debugger, CPU Profiler, and Heap Snapshot.
Using Debugger
Using OH_JSVM_OpenInspector
- Configure the permission for accessing the Internet in the module.json file of the application project.
"requestPermissions": [{
  "name": "ohos.permission.INTERNET",
  "reason": "$string:app_name",
  "usedScene": {
    "abilities": [
      "FromAbility"
    ],
    "when": "inuse"
  }
}]
- To prevent the pause during the debugging process from being falsely reported as no response, enable the DevEco Studio debug mode without setting breakpoints or run JSVM-API in threads except the main thread.
- Call OH_JSVM_OpenInspector to open an inspector instance on the specified host and port. For example, call OH_JSVM_OpenInspector(env, “localhost”, 9225) to create a socket on local port 9225 of the device.
- Call OH_JSVM_WaitForDebugger to wait for the setup of a socket connection.
- Check whether the port on the device is enabled successfully. For example, run hdc shell “netstat -anp|grep 9225”. If the status of port 9225 is LISTEN, the port is enabled.
- Forward port. For example, run hdc fport tcp:9229 tcp:9225 to forward port 9229 on a PC to port 9225 on a device. If Forwardport result:OK is returned, the port is forwarded successfully.
- Enter localhost:9229/json in the address box of Google Chrome and press Enter. Obtain port connection information. Copy the URL in the devtoolsFrontendUrl field to the address box and press Enter.
On the DevTools source code page displayed, the JS source code executed by OH_JSVM_RunScript in the application is displayed. The Debugger pauses at the first line of the JS source code.
> NOTE
The URL specified by the devtoolsFrontendUrl field can be opened only on Google Chrome or Microsoft Edge. Mozilla Firefox and Apple Safari are not supported. - You can set breakpoints on the source code page, send debugging commands using the buttons to control JS code execution, and view variables.
- Call OH_JSVM_CloseInspector to close the inspector instance and release the socket connection.
Example
If you are just starting out with JSVM-API, see JSVM-API Development Process. The following demonstrates only the C++ code involved.
#include "ark_runtime/jsvm.h"

#include <string>

using namespace std;

// JS source code to be debugged.
static string srcDebugger = R"JS(
const concat = (...args) => args.reduce((a, b) => a + b);
var dialogue = concat('"What ', 'is ', 'your ', 'name ', '?"');
dialogue = concat(dialogue, ' --', '"My ', 'name ', 'is ', 'Bob ', '."');
)JS";

// Enable Debugger.
static void EnableInspector(JSVM_Env env) {
    // Open an inspector instance on the specified host and port to create a socket.
    OH_JSVM_OpenInspector(env, "localhost", 9225);
    // Wait for the host to set up a socket connection with the inspector.
    OH_JSVM_WaitForDebugger(env, true);
}

// Close Debugger.
static void CloseInspector(JSVM_Env env) {
    // Close the inspector to release the socket connection.
    OH_JSVM_CloseInspector(env);
}

static void RunScript(JSVM_Env env) {
    JSVM_HandleScope handleScope;
    OH_JSVM_OpenHandleScope(env, &handleScope);

    JSVM_Value jsSrc;
    OH_JSVM_CreateStringUtf8(env, srcDebugger.c_str(), srcDebugger.size(), &jsSrc);

    JSVM_Script script;
    OH_JSVM_CompileScript(env, jsSrc, nullptr, 0, true, nullptr, &script);

    JSVM_Value result;
    OH_JSVM_RunScript(env, script, &result);

    OH_JSVM_CloseHandleScope(env, handleScope);
}

void TestJSVM() {
    JSVM_InitOptions initOptions{};
    OH_JSVM_Init(&initOptions);

    JSVM_VM vm;
    OH_JSVM_CreateVM(nullptr, &vm);
    JSVM_VMScope vmScope;
    OH_JSVM_OpenVMScope(vm, &vmScope);

    JSVM_Env env;
    OH_JSVM_CreateEnv(vm, 0, nullptr, &env);
    // Enable Debugger before executing the JS code.
    EnableInspector(env);
    JSVM_EnvScope envScope;
    OH_JSVM_OpenEnvScope(env, &envScope);

    // Execute the JS code.
    RunScript(env);

    OH_JSVM_CloseEnvScope(env, envScope);
    // Close Debugger after the JS code is executed.
    CloseInspector(env);
    OH_JSVM_DestroyEnv(env);
    OH_JSVM_CloseVMScope(vm, vmScope);
    OH_JSVM_DestroyVM(vm);
}
Using OH_JSVM_OpenInspectorWithName
- Configure the permission for accessing the Internet in the module.json file of the application project.
"requestPermissions": [{
  "name": "ohos.permission.INTERNET",
  "reason": "$string:app_name",
  "usedScene": {
    "abilities": [
      "FromAbility"
    ],
    "when": "inuse"
  }
}]
- To prevent the pause during the debugging process from being falsely reported as no response, enable the DevEco Studio debug mode without setting breakpoints or run JSVM-API in threads except the main thread.
- Enable the inspector port and connect to devtools for debugging.
Before executing the JS code, call OH_JSVM_OpenInspector to open an inspector instance on the specified host and port and create a socket. For example, call OH_JSVM_OpenInspectorWithName (env, 123, “test”) to create a TCP socket and the corresponding unixdomain port. - Call OH_JSVM_WaitForDebugger to wait for the setup of a socket connection.
- Check whether the port on the device is enabled successfully.
Run hdc shell “cat /proc/net/unix|grep jsvm”. An available Unix port is displayed, for example, jsvm_devtools_remote_9229_123, where 9229 is the TCP port number and 123 is the PID. - Forward port.
For example, run hdc fport tcp:9229 tcp:9229 to forward port 9229 on a PC to port 9229 on a device. If Forwardport result:OK is returned, the port is forwarded successfully. - Enter localhost:9229/json in the address box of Google Chrome and press Enter. Obtain port connection information. Open Google Chrome DevTools, copy the URL in the devtoolsFrontendUrl field to the address box, and press Enter.
On the DevTools source code page displayed, the JS source code executed by OH_JSVM_RunScript is displayed. The Debugger pauses at the first line of the JS code.
> NOTE
The URL specified by the devtoolsFrontendUrl field can be opened only on Google Chrome or Microsoft Edge. Mozilla Firefox and Apple Safari are not supported. - You can set breakpoints on the source code page, send debugging commands using the buttons to control JS code execution, and view variables.
- Call OH_JSVM_CloseInspector to close the inspector instance and release the socket connection.
Example
Replace the “//Enable Debugger” section with the following:
// Enable Debugger.
static void EnableInspector(JSVM_Env env) {
    // Open an inspector instance on the specified host and port to create a socket.
    OH_JSVM_OpenInspectorWithName(env, 123, "test");
    // Wait for the host to set up a socket connection with the inspector.
    OH_JSVM_WaitForDebugger(env, true);
}
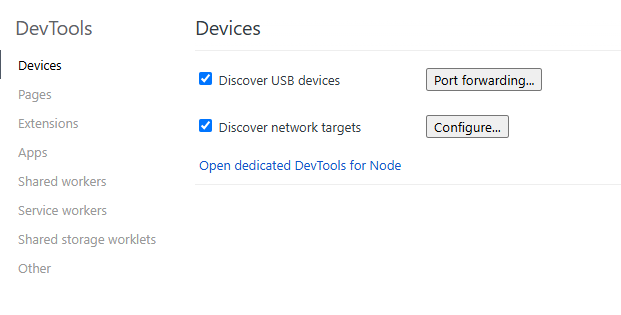
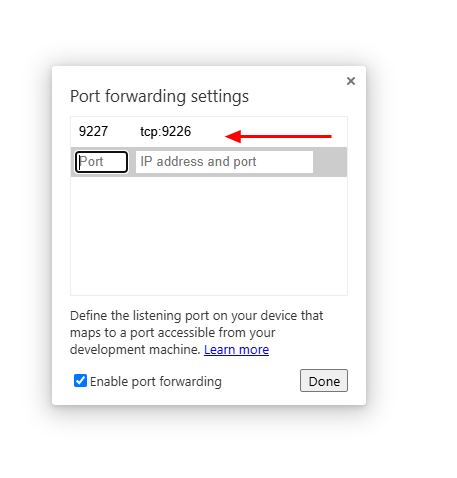
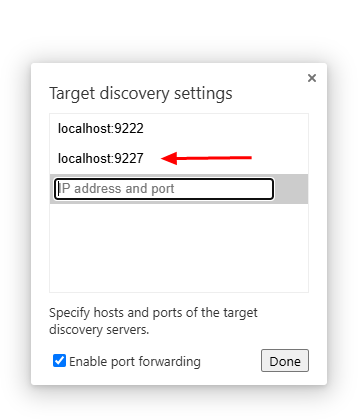
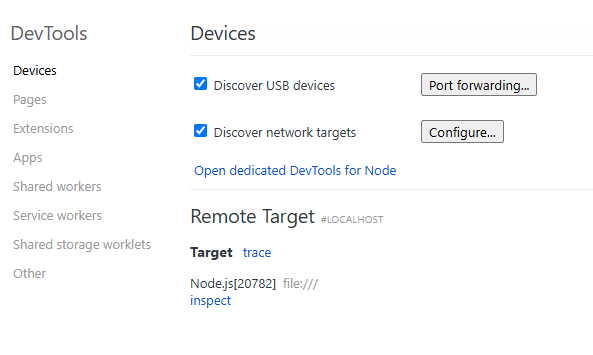
Using Chrome Inspect
In addition to opening the URL specified by the devtoolsFrontendUrl field for debugging, you can also open the chrome://inspect/#devices page on Google Chrome to perform debugging. The procedure is as follows: 1. On Google Chrome, enter chrome://inspect/#devices in the address box and press Enter. On the page displayed, select the following options:
Using WebSocket Port
In addition to opening the URL specified by the devtoolsFrontendUrl field through Chrome DevTools, if you know how to use Chrome DevTools Protocol (CDP), you can also connect to the WebSocket port provided by Inspector for debugging.
The procedure is as follows: After port mapping (for example, mapping to port 9229) is complete, enter localhost:9229/json in the address box of Chrome and press Enter to obtain the URL of the webSocketDebuggerUrl field. Then, use the standard WebSocket client to connect to the URL to send CDP for debugging. Note that the WebSocket port provided by Inspector of the current version can receive only text frames, ping frames, and connection close frames. All other types of frames are considered as error frames, which will interrupt the WebSocket connection.
For details about CDP, see the official document.
Using CPU Profiler and Heap Snapshot
Using CPU Profiler APIs
- Before executing the JS code, call OH_JSVM_StartCpuProfiler to start sampling and return a JSVM_CpuProfiler instance.
- Run the JS code and call OH_JSVM_StopCpuProfiler, in which you need to pass in the JSVM_CpuProfiler instance (obtained in step 1), callback for the output stream, and pointer to the output stream. Then, the data will be written to the specified output stream.
- Obtain the output data in JSON strings. You can also save it to the .cpuprofile file, which can be parsed into profiling views with the Chrome DevTools-JavaScript Profiler.
Using Heap Snapshot APIs
- To analyze the heap object creation of a piece of JS code, call OH_JSVM_TakeHeapSnapshot before and after the JS code is executed. You need to pass in the callback used to return the output stream and the pointer to the output stream. Then, the data will be written to the specified output stream.
- Save the output data to the .heapsnapshot file, which can be parsed into memory analysis views with the Chrome DevTools-Memory.
Example
If you are just starting out with JSVM-API, see JSVM-API Development Process. The following demonstrates only the C++ code involved.
#include "ark_runtime/jsvm.h"

#include <fstream>
#include <iostream>

using namespace std;

// JS code to be optimized.
static string srcProf = R"JS(
function sleep(delay) {
    var start = (new Date()).getTime();
    while ((new Date()).getTime() - start < delay) {
        continue;
    }
}

function work3() {
    sleep(300);
}

function work2() {
    work3();
    sleep(200);
}

function work1() {
    work2();
    sleep(100);
}

work1();
)JS";

// Callback for the data output stream, which is customized to process the returned data. In this example, the output data is written to a file.
static bool OutputStream(const char *data, int size, void *streamData) {
    auto &os = *reinterpret_cast<ofstream *>(streamData);
    if (data) {
        os.write(data, size);
    } else {
        os.close();
    }
    return true;
}

static JSVM_CpuProfiler ProfilingBegin(JSVM_VM vm) {
    // Specify the path of the file saving the output profiling data. In this example, the sandbox path is /data/storage/el2/base/files, and the bundle name is com.example.helloworld.
    // The output data will be saved to /data/app/el2/100/base/com.example.helloworld/files/heap-snapshot-begin.heapsnapshot.
    ofstream heapSnapshot("/data/storage/el2/base/files/heap-snapshot-begin.heapsnapshot",
                          ios::out|ios:: binary|ios::trunc);
    // Task a heap snapshot before the JS code is executed.
    OH_JSVM_TakeHeapSnapshot(vm, OutputStream, &heapSnapshot);
    JSVM_CpuProfiler cpuProfiler;
    // Start the CPU Profiler.
    OH_JSVM_StartCpuProfiler(vm, &cpuProfiler);
    return cpuProfiler;
}

// Stop the profiling data collection tool.
static void ProfilingEnd(JSVM_VM vm, JSVM_CpuProfiler cpuProfiler) {
    // Specify the path of the file saving the output profiling data. In this example, the sandbox path is /data/storage/el2/base/files, and the bundle name is com.example.helloworld.
    // The output data will be saved to /data/app/el2/100/base/com.example.helloworld/files/cpu-profile.cpuprofile.
    ofstream cpuProfile("/data/storage/el2/base/files/cpu-profile.cpuprofile",
                        ios::out|ios:: binary|ios::trunc);
    // Stop the CPU Profiler to obtain data.
    OH_JSVM_StopCpuProfiler(vm, cpuProfiler, OutputStream, &cpuProfile);
    ofstream heapSnapshot("/data/storage/el2/base/files/heap-snapshot-end.heapsnapshot",
                              ios::out|ios:: binary|ios::trunc);
    // After the JS is executed, take a heap snapshot again and compare the two snapshots for further analysis.
    OH_JSVM_TakeHeapSnapshot(vm, OutputStream, &heapSnapshot);
}

static JSVM_Value RunScriptWithStatistics(JSVM_Env env, JSVM_CallbackInfo info) {
    JSVM_VM vm;
    OH_JSVM_GetVM(env, &vm);

    // Start profiling.
    auto cpuProfiler = ProfilingBegin(vm);

    JSVM_HandleScope handleScope;
    OH_JSVM_OpenHandleScope(env, &handleScope);

    JSVM_Value jsSrc;
    OH_JSVM_CreateStringUtf8(env, srcProf.c_str(), srcProf.size(), &jsSrc);

    JSVM_Script script;
    OH_JSVM_CompileScript(env, jsSrc, nullptr, 0, true, nullptr, &script);

    JSVM_Value result;
    // Execute the JS code.
    OH_JSVM_RunScript(env, script, &result);

    OH_JSVM_CloseHandleScope(env, handleScope);

    // End profiling.
    ProfilingEnd(vm, cpuProfiler);
    return nullptr;
}
static JSVM_CallbackStruct param[] = {
    {.data = nullptr, .callback = RunScriptWithStatistics},
};
static JSVM_CallbackStruct *method = param;
// Alias for the runScriptWithStatistics method to be called from JS.
static JSVM_PropertyDescriptor descriptor[] = {
    {"runScriptWithStatistics", nullptr, method++, nullptr, nullptr, nullptr, JSVM_DEFAULT},
};
// Call C++ code from JS.
const char *srcCallNative = R"JS(runScriptWithStatistics();)JS";
Expected result:
Two files are generated in the Harmony device for subsequent optimization.
heap-snapshot-end.heapsnapshot,
cpu-profile.cpuprofile
For file features, see API usage.
你可能感兴趣的鸿蒙文章
harmony 鸿蒙Building an NDK Project with CMake
harmony 鸿蒙Building an NDK Project with the DevEco Studio Template
harmony 鸿蒙NDK Project Building Overview
harmony 鸿蒙Building an NDK Project with Prebuilt Libraries
harmony 鸿蒙C/C++ Library Mechanisms
harmony 鸿蒙Creating an NDK Project
- 所属分类: 后端技术
- 本文标签:
热门推荐
-
2、 优质文章
-
3、 gt
-
7、 openharmony
-
9、 golang
-
10、 Vue中input框自动聚焦