harmony 鸿蒙<chart> Development
<chart> Development
The <chart> component displays line charts, gauge charts, and bar charts. For details, see chart.
Creating a <chart> Component
Create a <chart> component in the .hml file under pages/index.
<!-- xxx.hml -->
<div class="container">
  <chart class="chart-data" type="line" options="{{lineOps}}" datasets="{{lineData}}"></chart>
</div>
/* xxx.css */
.container {
  width: 100%;
  height: 100%;
  flex-direction: column;
  justify-content: center;
  align-items: center;
  background-color: #F1F3F5;
}
.chart-data {
  width: 700px;
  height: 600px;
}
// xxx.js
export default {
  data: {
    lineData: [
      {
        data: [763, 550, 551, 554, 731, 654, 525, 696, 595, 628, 791, 505, 613, 575, 475, 553, 491, 680, 657, 716]
      }
    ],
    lineOps: {
      xAxis: {
        min: 0,
        max: 20,
        display: false,
      },
      yAxis: {
        min: 0,
        max: 1000,
        display: false,
      },
      series: {
        lineStyle: {
          width: 15,
        },
      }
    },
  }
}
Setting the Chart Type
Define the chart type using the type attribute, for example, setting a chart to a bar chart.
<!-- xxx.hml -->
<div class="container">
  <div class="container">
    <div class="switch-block">
      <text class="title">
        {{ title }}
      </text>
    </div>
    <tabs class="tabs" index="0" vertical="false" onchange="changes">
      <tab-content class="tabcontent" scrollable="true">
        <tabs >
          <tab-bar class="tab-bar" mode="fixed"style="margin-bottom: 50px;">
            <text class="tab-text">Line chart</text>
            <text class="tab-text">Bar chart</text>
            <text class="tab-text">Gauge chart</text>
          </tab-bar>
          <tab-content>
            <div class="bar-block" style="margin-left: 30px;">
              <chart class="chart-data" type="line" ref="linechart" options="{{ lineOps }}" datasets="{{ lineData }}">
              </chart>
            </div>
            <div class="bar-block">
              <chart class="data-bar" type="bar" id="bar-chart" options="{{ barOps }}" datasets="{{ barData }}">
              </chart>
            </div>
            <div class="chart-block">
              <chart type="gauge" ></chart>
            </div>
          </tab-content>
        </tabs>
      </tab-content>
    </tabs>
  </div>
</div>
/* xxx.css */
.container {
  width: 100%;
  height: 100%;
  flex-direction: column;
  justify-content: center;
  background-color: #F1F3F5;
}
.tab-bar{
  background-color: #F1F3F5;
}
.chart-data {
  width: 700px;
  height: 600px;
}
.title{
  margin-left: 50px;
  margin-top: 50px;
  font-size: 50px;
}
.line-block{
  align-items: center;
  justify-content: center;
}
.bar-block{
  align-items: center;
  justify-content: center;
}
.chart-block{
  width: 90%;
  margin-left: 30px;
}
// xxx.js
export default {
  data: {
    title:"Type display",
    barData: [
      {
        fillColor: '#3848e8',
        data: [763, 550, 551, 554, 731, 654, 525, 696, 595],
      }
    ],
    lineData: [
      {
        strokeColor: '#0081ff',
        fillColor: '#cce5ff',
        data: [763, 550, 551, 554, 731, 654, 525, 696, 595, 628, 791, 505, 613, 575, 475, 553, 491, 680, 657, 716],
        gradient: true,
      }
    ],
    lineOps: {
      xAxis: {
        min: 0,
        max: 20,
        display: false,
      },
      yAxis: {
        min: 0,
        max: 1000,
        display: false,
      },
      series:{
        lineStyle: {
          width: "5px",
          smooth: true,
        },
        headPoint: {
          shape:"circle",
          size: 20,
          strokeWidth: 5,
          fillColor: '#ffffff',
          strokeColor: '#007aff',
          display: true,
        },
        loop:{
          margin: 2,
          gradient: true
        }
      },
    },
    barOps: {
      xAxis: {
        min: 0,
        max: 20,
        display: false,
        axisTick: 10,
      },
      yAxis: {
        min: 0,
        max: 1000,
      },
    },
  },
}
NOTE
The <chart> component does not display the value of each point.
Setting the Chart Attributes
In the options attribute of the <chart> component, you can set the x-axis, y-axis, and data series parameters. In the datasets attribute, you can set the line color, fill color, gradient fill color, and drawing point set.
<!-- xxx.hml -->
<div class="container">
  <chart class="chart-data" type="line" options="{{lineOps}}" datasets="{{lineData}}"></chart>
</div>
/* xxx.css */
.container {
  width: 100%;
  height: 100%;
  flex-direction: column;
  justify-content: center;
  align-items: center;
  background-color: #F1F3F5;
}
.chart-data {
  width: 700px;
  height: 600px;
}
// xxx.js
export default {
  data: {
    // Line chart data
    lineData: [
      {
        strokeColor: '#0081ff',
        fillColor: '#cce5ff',  // Fill color
        data: [463, 250, 251, 254, 431, 354, 225, 396, 295, 328, 491, 205, 313, 275, 475, 553, 491, 380, 357, 416],
        gradient: true,
      }
    ],
   lineOps: {
     // X-axis parameters
      xAxis: {
        min: 0,
        max: 20,
        display: false,
      },
     // Y-axis parameters
      yAxis: {
        min: 0,
        max: 1000,
        display: false,
      },
     // Data series parameters
      series: {
        // Line style
        lineStyle: {
          width: "5px",
          smooth: true,
        },
        // Style and size of the white point at the start of the line
        headPoint: {
          shape: "circle",
          size: 20,
          strokeWidth: 5,
          fillColor: '#ffffff',
          strokeColor: '#007aff',
          display: true,
        },
        // Whether to start drawing again when the screen is looped.
        loop: {
          margin: 2,
          gradient: true
        }
      }
    },
  },
}
NOTE - The options attribute supports the settings of bar charts and line charts but does not support those of gauge charts.
The datasets attribute supports the datasets for bar charts and line charts but does not support those of gauge charts.
Only line charts support series.
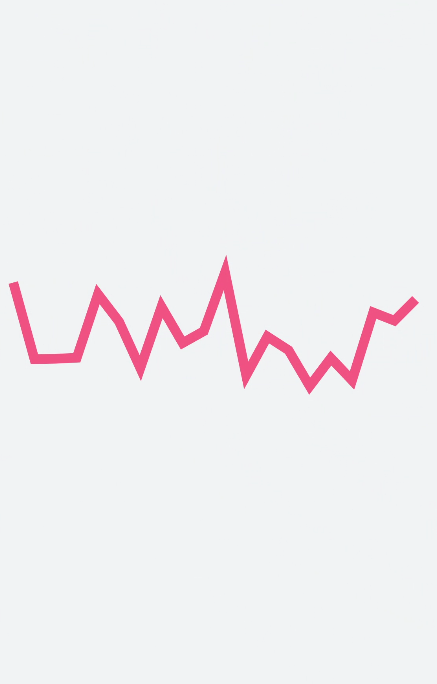
Adding Data
Use the append method of the <chart> component to dynamically add data.
<!-- xxx.hml -->
<div class="container">
  <stack class="chart-region">
    <chart class="chart-data" type="line" ref="linechart" options="{{lineOps}}" datasets="{{lineData}}"></chart>
  </stack>
  <button value="Add data" onclick="addData"></button>
</div>
/* xxx.css */
.container {
  flex-direction: column;
  justify-content: center;
  align-items: center;
  background-color: #F1F3F5;
}
.chart-region {
  height: 400px;
  width: 700px;
}
.chart-data {
  width: 700px;
  height: 600px;
}
button {
  width: 100%;
  height: 50px;
  background-color: #F4F2F1;
  text-color: #0C81F3;
  margin-top: 30px;
}
// xxx.js
export default {
  data: {
    lineData: [
      {
        strokeColor: '#de0b6e',
        fillColor: '#bb09a3',
        data: [763, 550, 551, 554, 731, 654, 525, 696, 595, 628, 791, 505, 613, 575, 475, 553, 491, 680, 657, 716],
        gradient: true,
      }
    ],
    lineOps: {
      xAxis: {
      min: 0,
      max: 20,
      display: false,
      },
      yAxis: {
        min: 0,
        max: 1000,
        display: false,
      },
      series: {
        lineStyle: {
          width: "5px",
          smooth: true,
        },
        headPoint: {
          shape: "circle",
          size: 20,
          strokeWidth: 5,
          fillColor: '#ffffff',
          strokeColor: '#f8145c',
          display: true,
        },
        loop: {
          margin: 2,
          gradient: true,
        }
      }
    },
  },
  addData() {
    this.$refs.linechart.append({
    serial: 0,
      data: [Math.floor(Math.random() * 400) + 200]
    })
  }
}
Example Scenario
Select the data display status using <switch>. When <switch> is set to true, the timer is used to dynamically display data.
<!-- xxx.hml -->
<div class="container">
  <div class="container">
    <div class="switch-block">
      <text class="title">{{ title }} </text>
      <switch class="switch" showtext="{{ showText }}" allow-scale="{{ allowScale }}"onchange="change">
      </switch>
    </div>
    <tabs class="tabs" index="0" vertical="false" onchange="changes">
      <tab-content class="tabcontent" scrollable="true">
        <div>
          <tabs class="tabs" index="0" vertical="false" onchange="changes">
            <tab-content class="tabcontent" scrollable="true">
              <div class="line-class">
                <div class="bar-block">
                  <chart class="chart-data" type="line" ref="linechart" options="{{ lineOps }}"
                  datasets="{{ lineData }}">
                  </chart>
                </div>
                <div class="bar-block">
                  <chart class="data-bar" type="bar" id="bar-chart" options="{{ barOps }}"datasets="{{ barData }}">
                  </chart>
                </div>
             </div>
           </tab-content>
         </tabs>
       </div>
       <div>
         <div class="container">
           <list class="todo-wrapper">
             <list-item for="{{ barData }}" class="todo-item">
               <text class="todo-title">{{ $item.data }}</text>
             </list-item>
           </list>
           <list class="todo-wrapper">
             <list-item for="{{ lineData.data }}" class="todo-item">
               <text class="todo-title">{{ $item.value }}</text>
             </list-item>
           </list>
         </div>
       </div>
      </tab-content>
    </tabs>
  </div>
</div>
/* xxx.css */
.container{
  display:flex;
  flex-direction:column;
  background-color: #F1F3F5;
}
.line-class{
  display: flex;
  flex-direction: column;
}
.title{
  font-size: 40px;
  margin-left: 40px;
}
.switch-block {
  margin-top: 30px;
  width: 98%;
  height: 80px;
  display: flex;
  justify-content: space-between;
}
.switch{
  font-size: 40px;
}
.bar-block {
  margin-top: 80px;
  margin-left: 40px;
  position: relative;
  width: 90%;
  border-radius: 10px;
  background-color: #25FAB27B;
  height: 40%;
  justify-content: center;
}
// xxx.js
export default {
  data: {
    interval: null,
    title: "Data Display",
    allowScale: true,
    dataLength: 30,
    barGroup: 3,
    lineData: null,
    lineOps: {
      xAxis: {
        min: 0,
        max: 5
      },
      yAxis: {
        min: 0,
        max: 100
      },
      series: {
        lineStyle: {
        width: '1px',
      },
        headPoint: {
          shape: 'circle',
          size: 10,
          strokeWidth: 2,
          fillColor: '#ffffff',
          strokeColor: '#8477DF'
        },
        loop: {
          margin: 2
        }
      }
    },
    barData: [
      {
        fillColor: '#97CF0A2C',
        data: [20, 20,40, 56]
      },
      {
        fillColor: '#6D0A7ACF',
        data: [52, 40, 2, 67]
      },
      {
        fillColor: '#6A0ACFA1',
        data: [56, 2, 77, 40]
      }
    ],
    barOps: {
      xAxis: {
        min: 0,
        max: 20,
        axisTick: 5
      },
      yAxis: {
        min: 0,
        max: 100
      }
    }
  },
  onInit() {
    this.changeLine();
  },
  change(e) {
    if (e.checked) {
      this.interval = setInterval(() => {
        this.changeLine();
        this.changeBar();
      }, 1000)
    } else {
      clearInterval(this.interval);
    }
  },
  changeLine() {
    var dataArray = [];
    for (var i = 0; i < this.dataLength; i++) {
      var nowValue = Math.floor(Math.random() * 99 + 1);
      var obj = {
        "value": nowValue,
        "description": nowValue + "",
        "textLocation": "top",
        "textColor": "#CDCACA",
        "pointStyle": {
          "shape": "circle",
          "size": 5,
          "fillColor": "#CF0A2C",
          "strokeColor": "#CF0A2C"
        }
      };
      dataArray.push(obj);
    }
    this.lineData = [
      {
        strokeColor: '#0081ff',
        fillColor: '#FF07CDC4',
        data: dataArray,
        gradient: true,
      }
    ]
  },
  changeBar() {
    for (var i = 0;i < this.barGroup; i++) {
      var dataArray = this.barData[i].data;
      for (var j = 0;j < 4; j++) {
        dataArray[j] = Math.floor(Math.random() * 99 + 1);
      }
    }
    this.barData = this.barData.splice(0, this.barGroup + 1);
  },
  changes(e) {
    console.log("Tab index: " + e.index);
  },
}
你可能感兴趣的鸿蒙文章
harmony 鸿蒙Atomic Service Full Screen Launch Component (FullScreenLaunchComponent)
harmony 鸿蒙Arc Button (ArcButton)
harmony 鸿蒙Frame Animation (ohos.animator)
harmony 鸿蒙Implementing Property Animation
热门推荐
-
2、 优质文章
-
3、 gt
-
7、 openharmony
-
9、 golang
-
10、 Vue中input框自动聚焦